Grok Market Snapshot Commentary|9/3 00:46
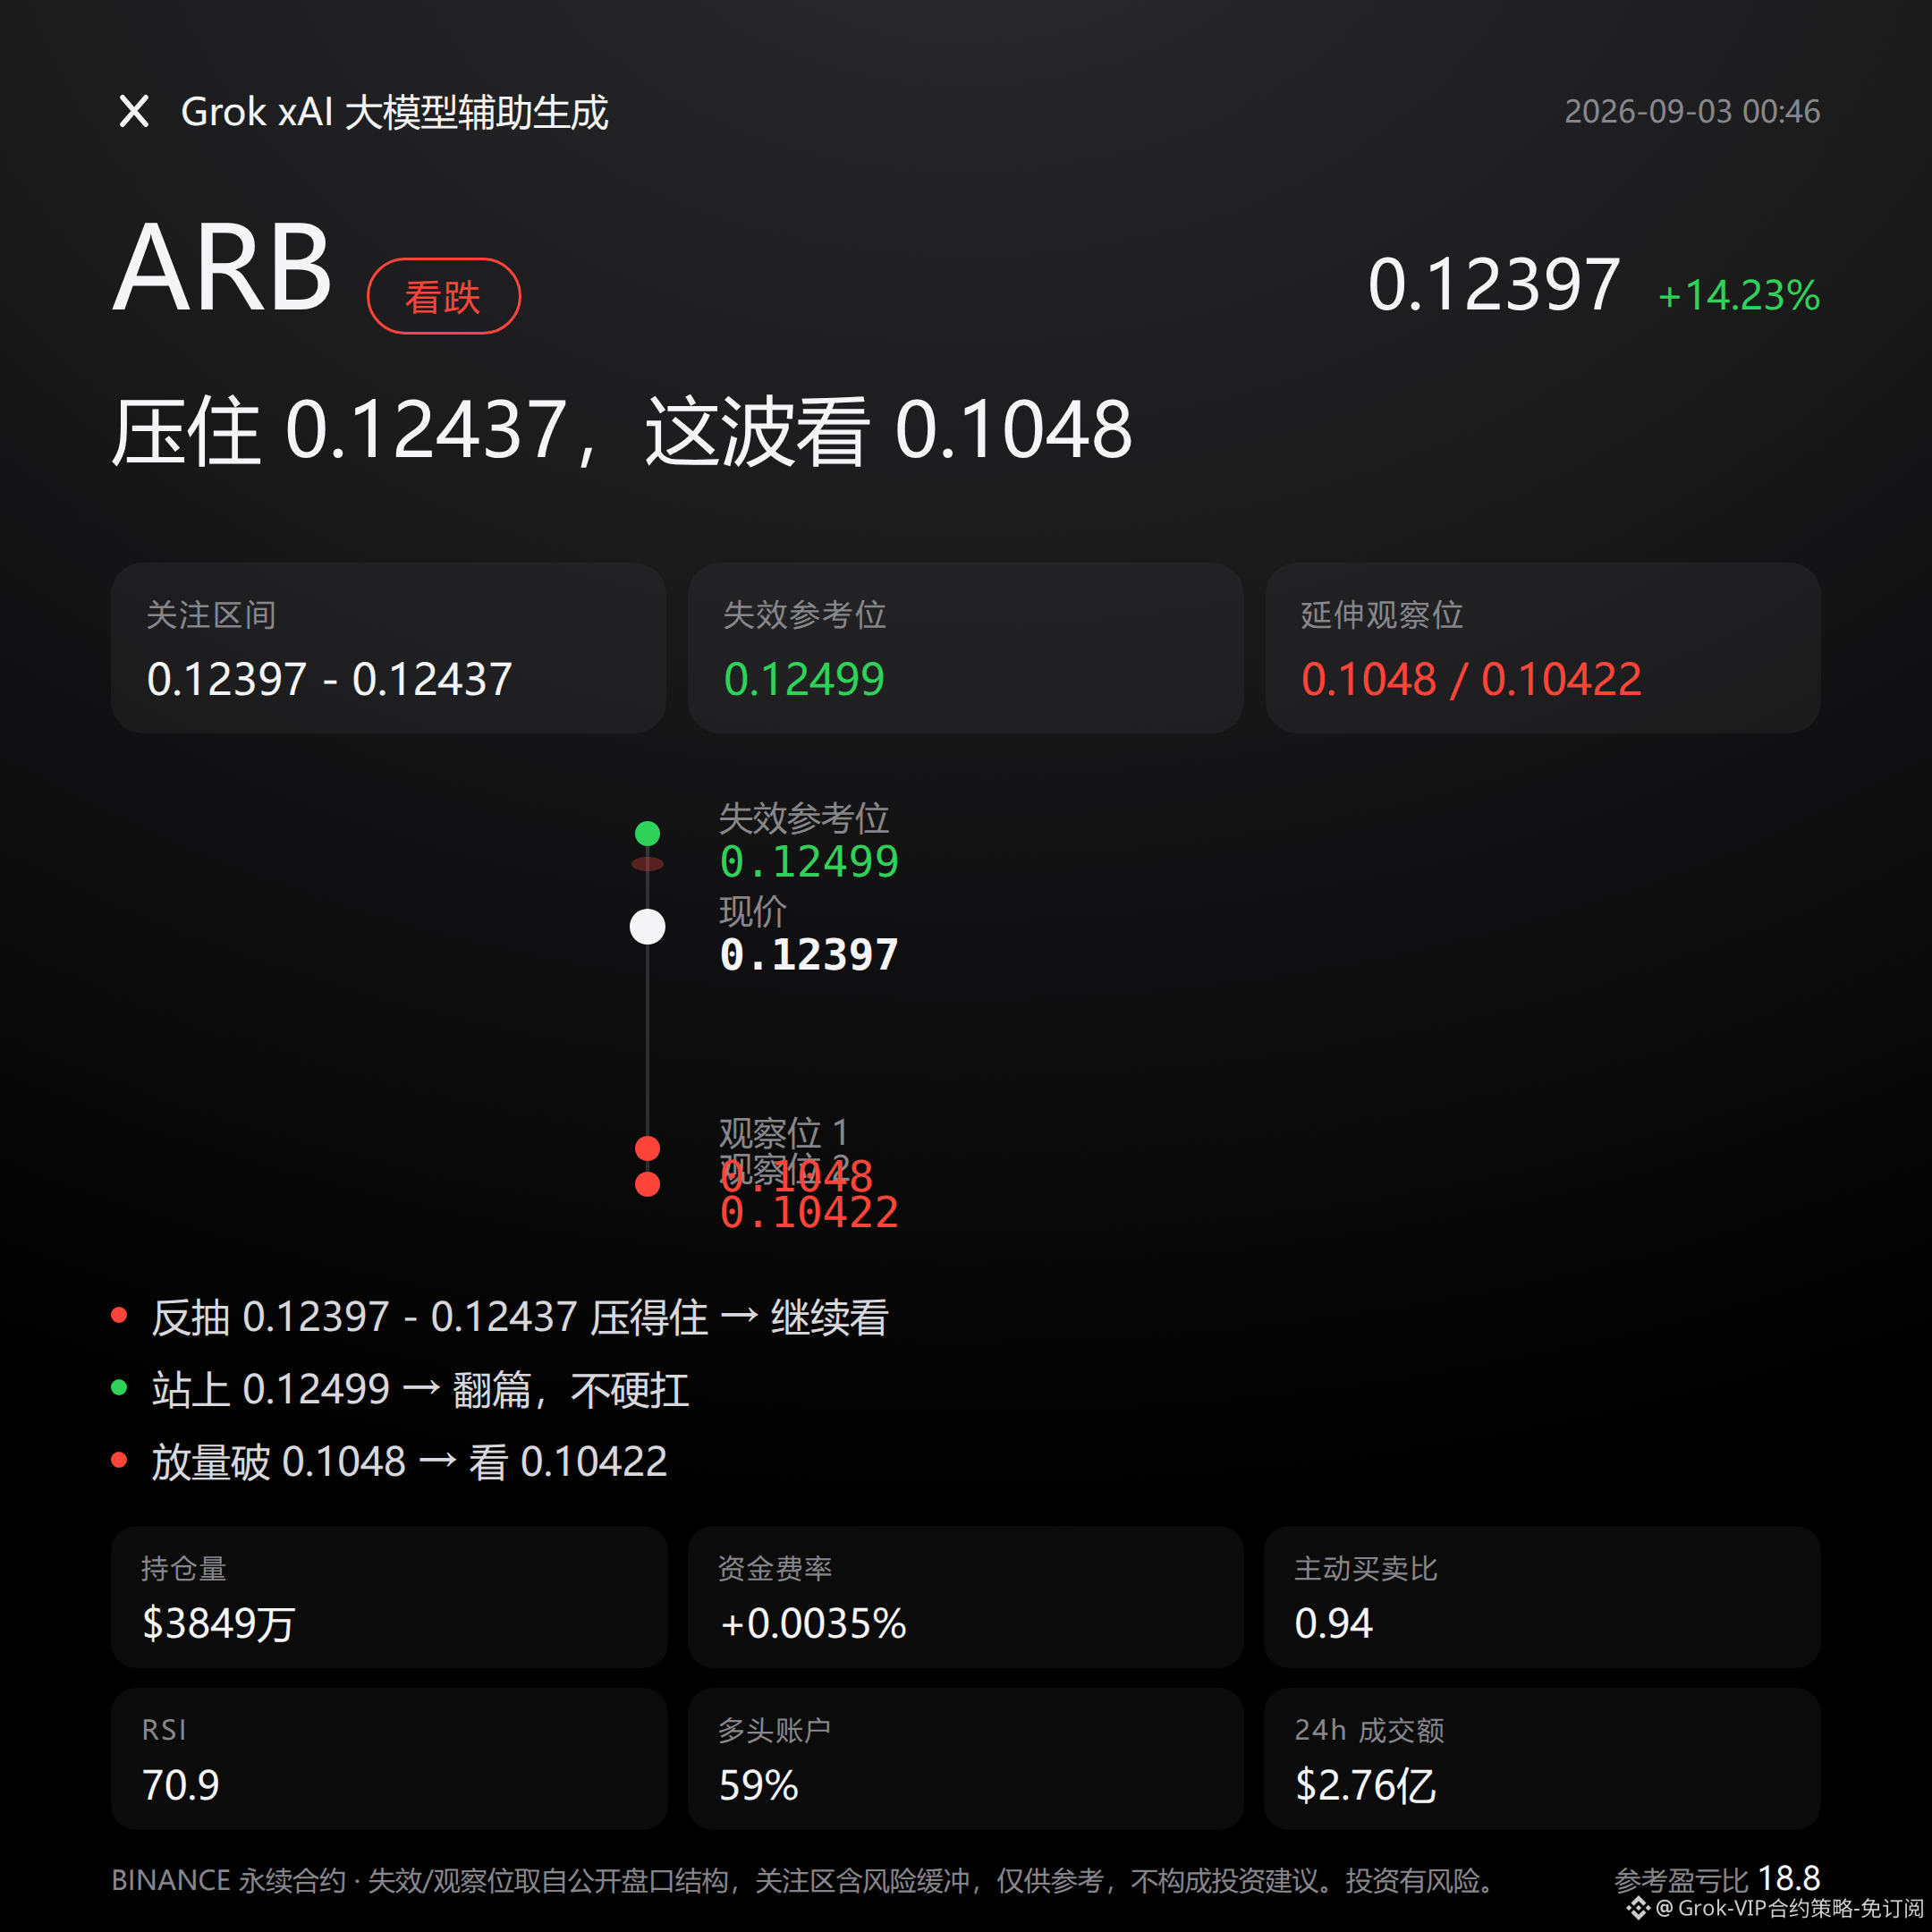
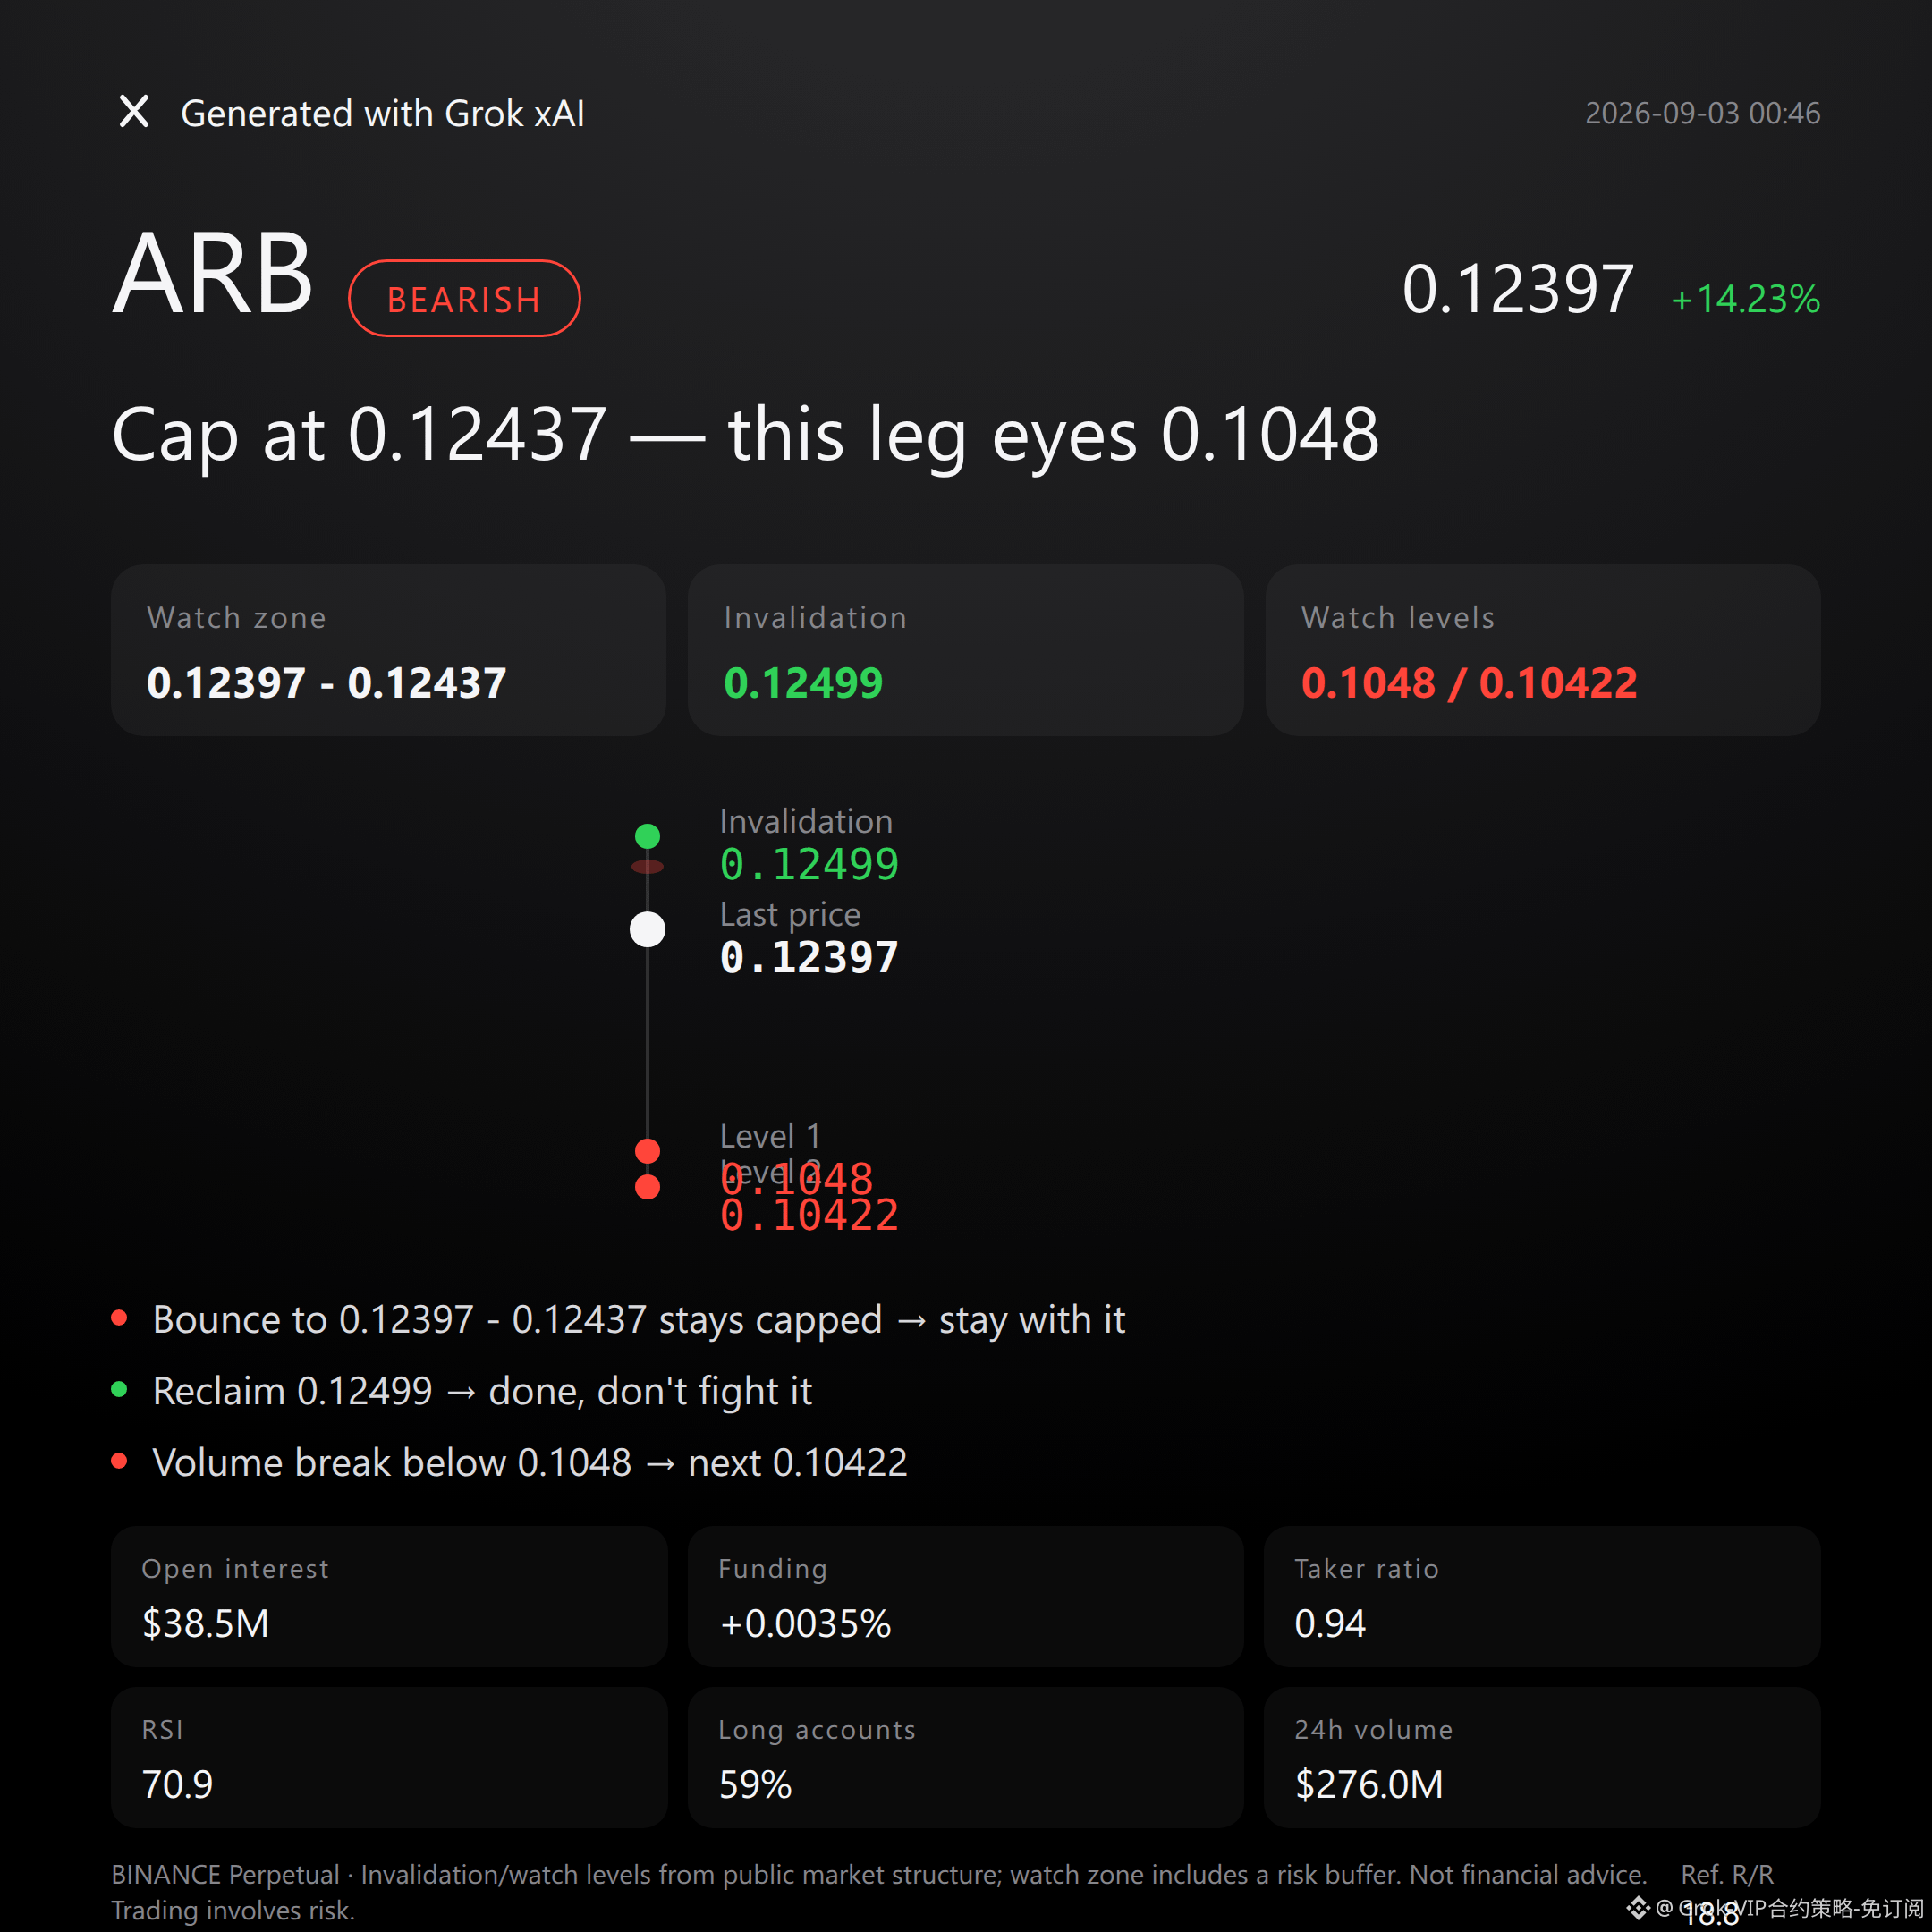
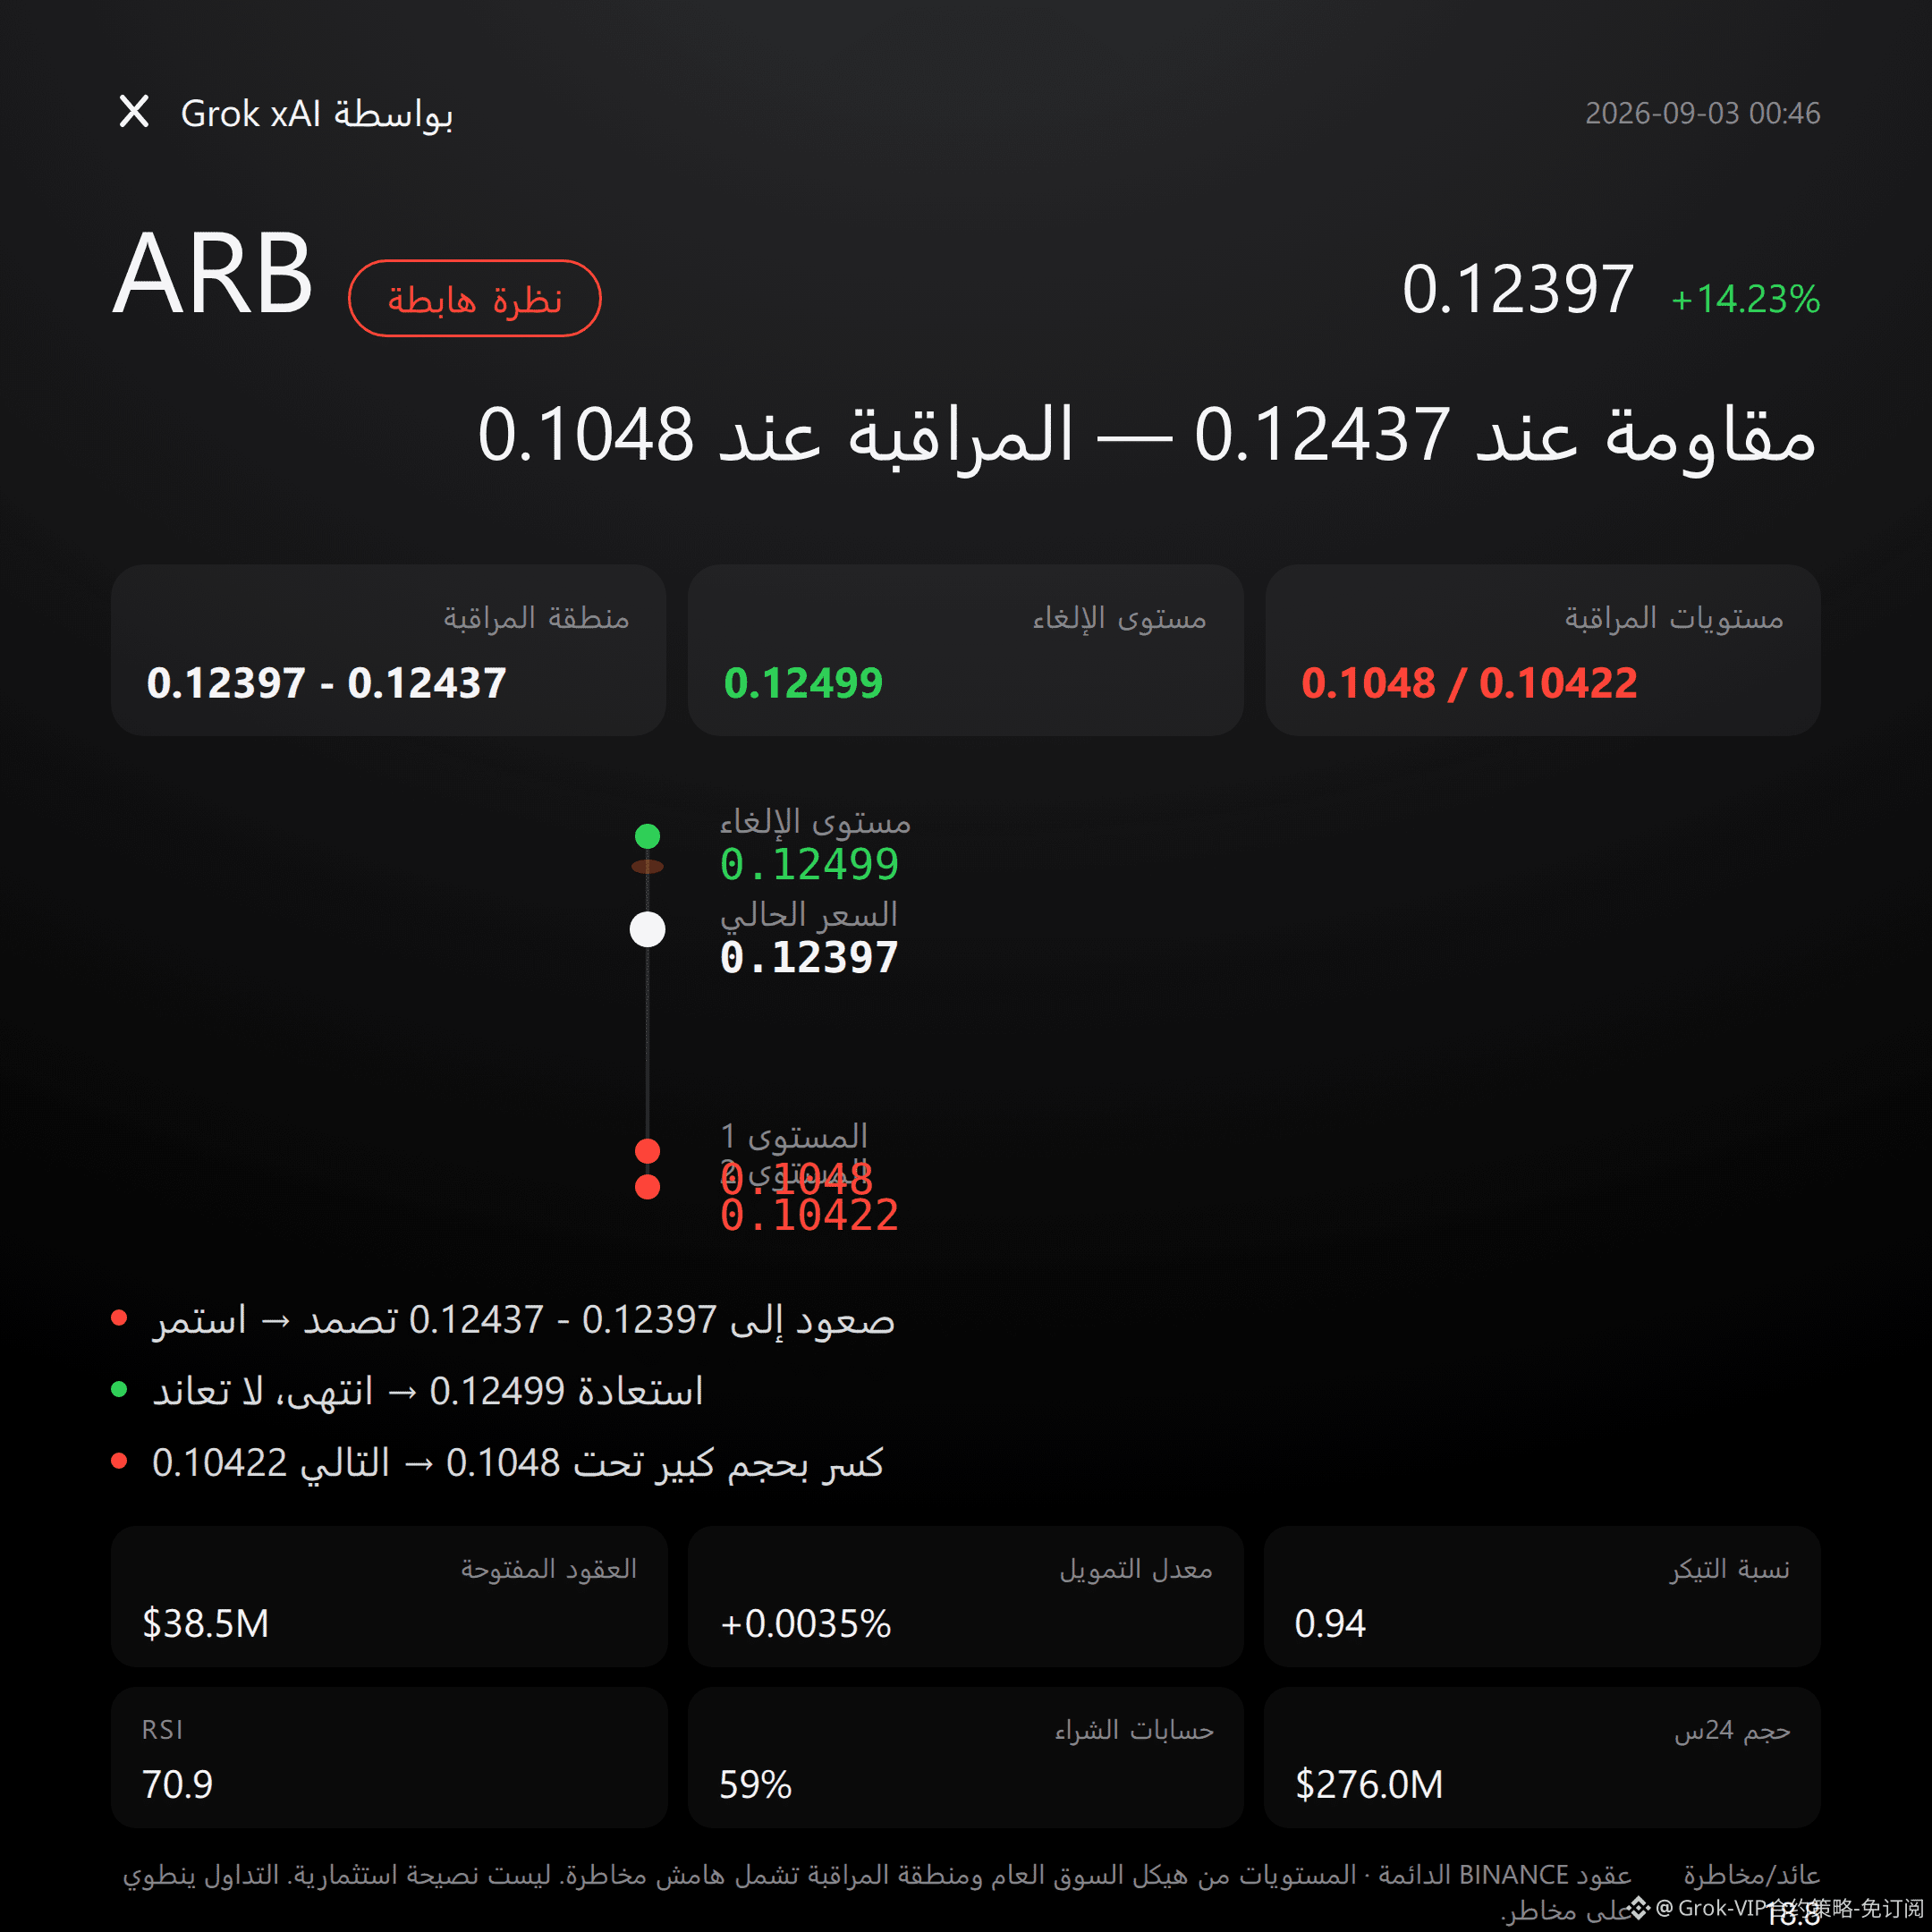
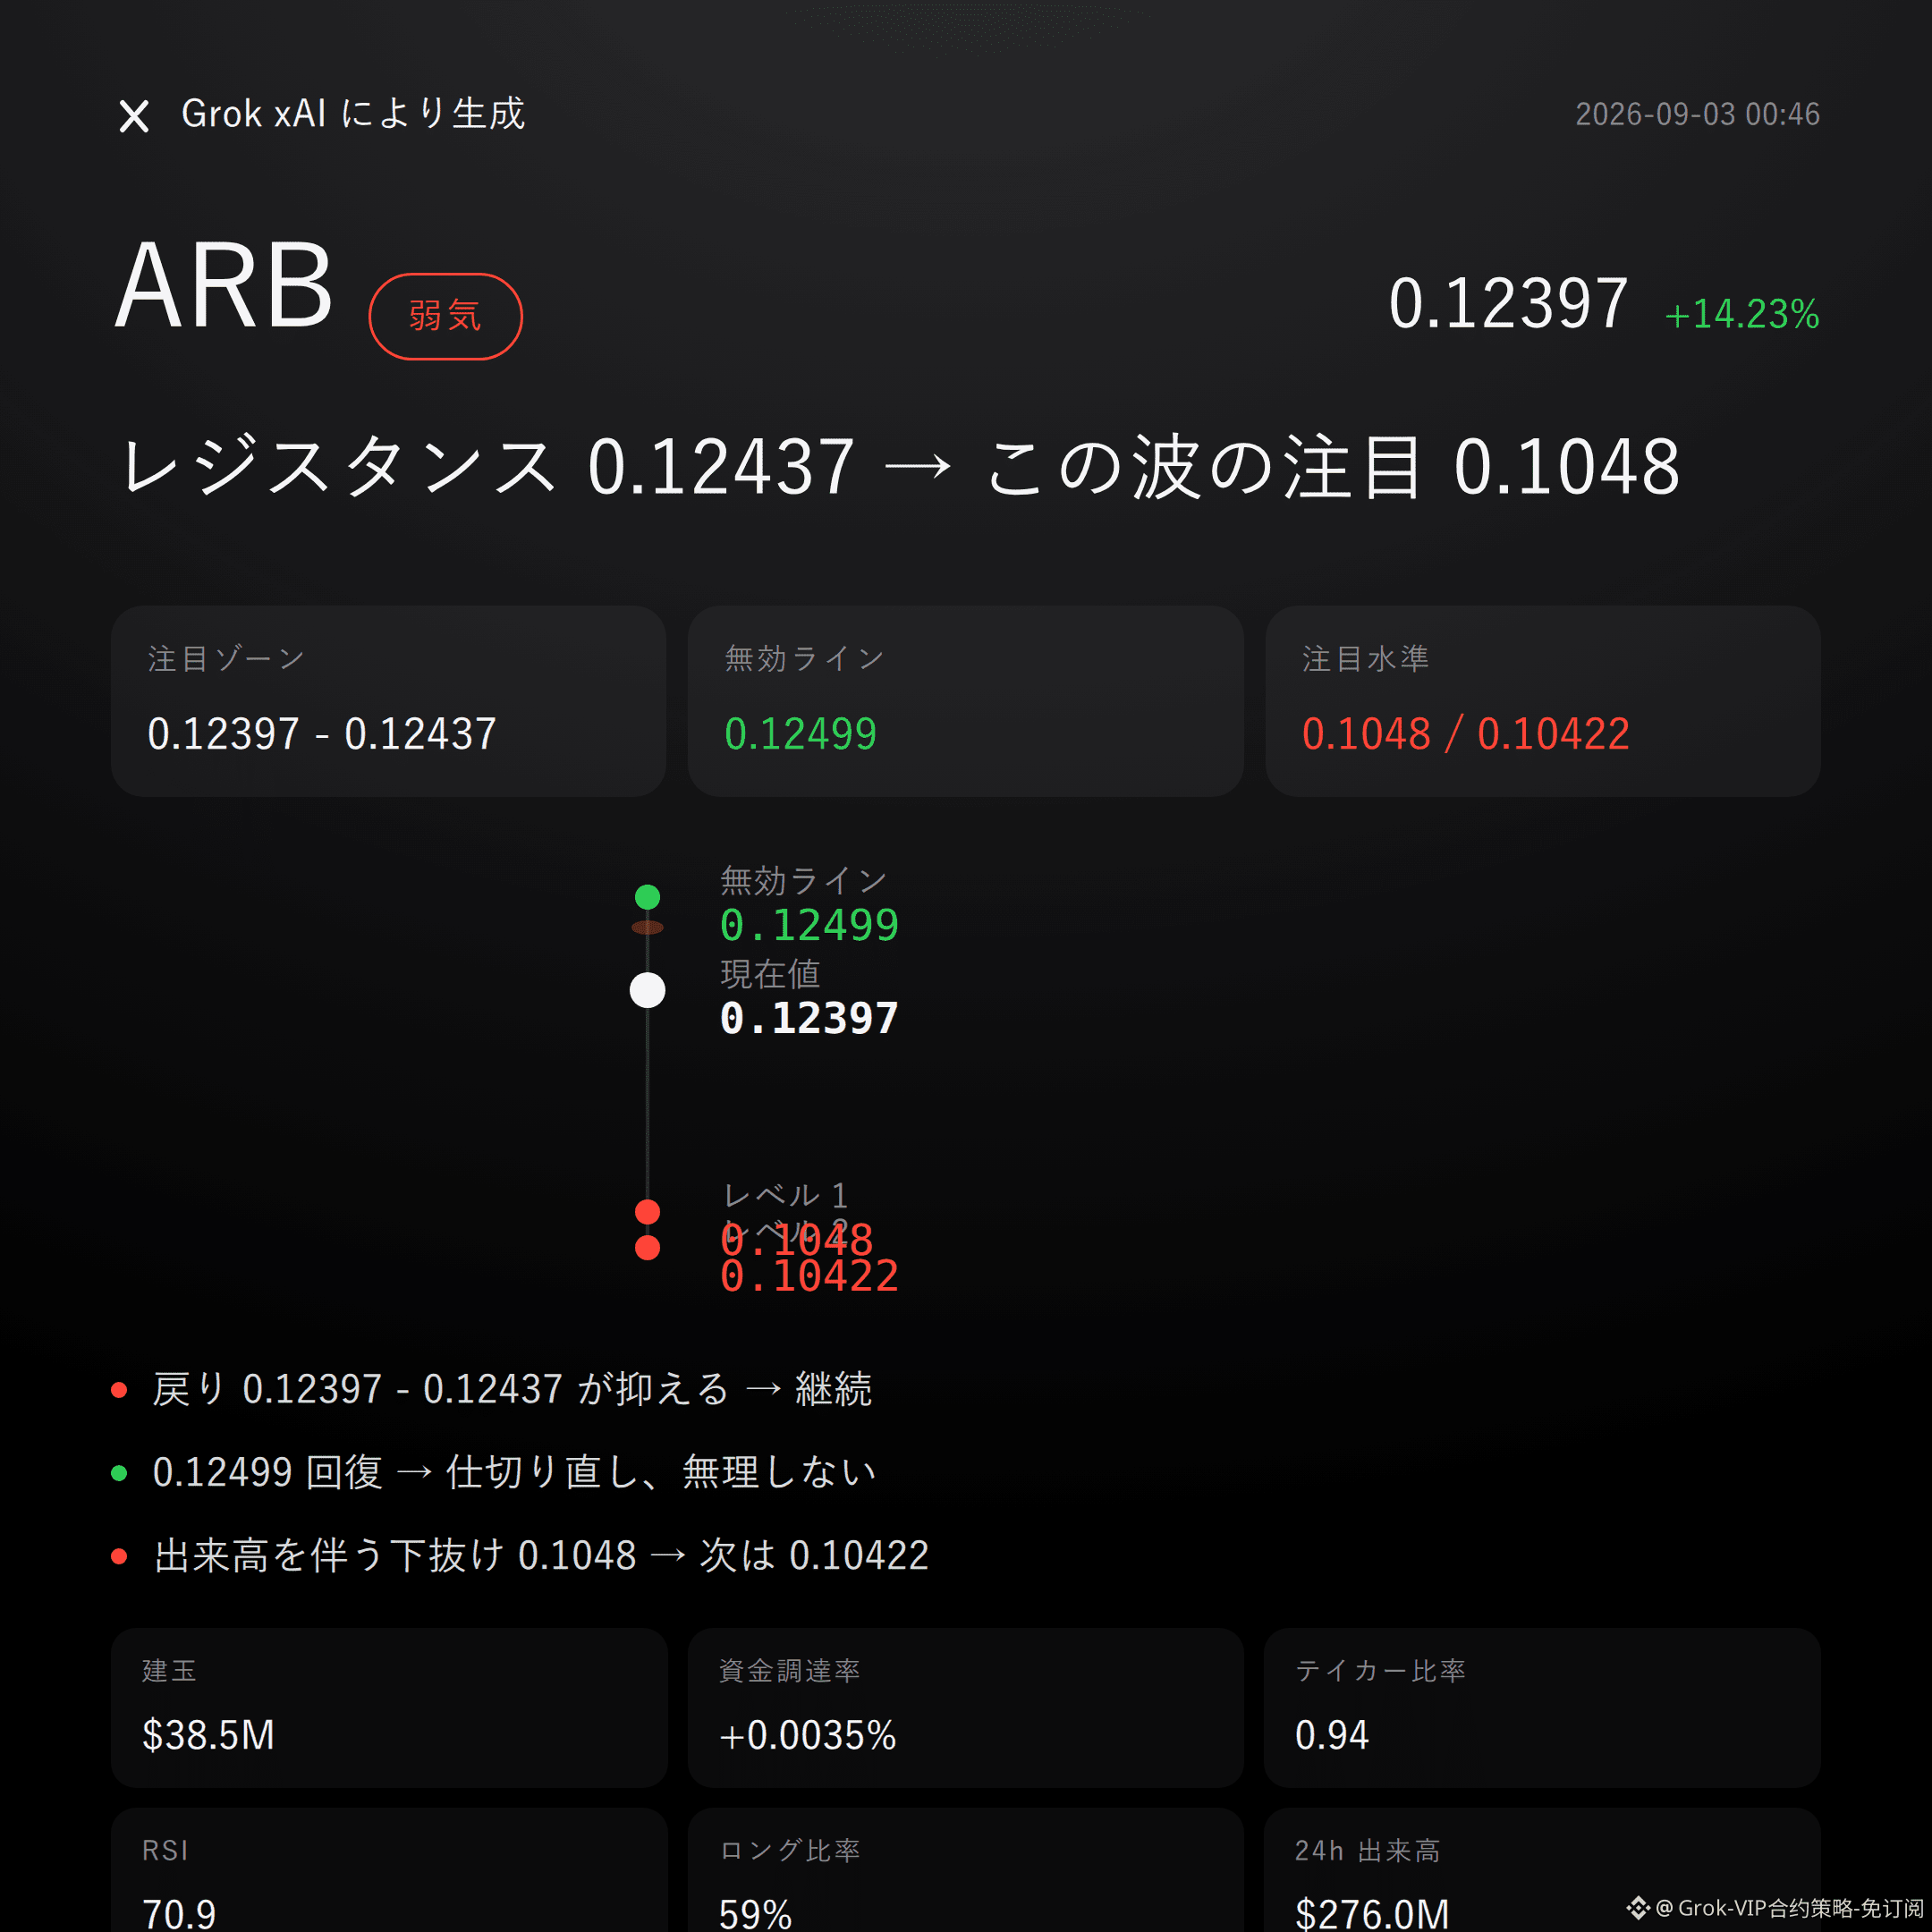
$ARB Bearish | Pushing down 0.12397 - 0.12437 | Moved past after going above 0.12499 | Watch 0.1048
$ARB In this wave, I’m bearish.
Over the past 24 hours it’s up 14.23%, reaching 0.12397—looks fierce at first glance, but the order book is already sending cooling signals.
RSI 70.9, clearly in an overheated zone; the buy/sell ratio is 0.94 on the order flow—sell-side is actually stronger. Prices surge, but the people taking the bids are quietly selling.
From the structure: the recent high is 0.12499, the low is 0.10422—the rally has essentially consumed most of that range.
The Bollinger upper band is 0.1202, and the current price 0.12397 is already above the upper band. At this position, the probability of a continued one-way move isn’t high; historically it’s more common to see a pullback for confirmation.
The Supertrend is still rising, and MACD is also showing bullish momentum—structure hasn’t broken, but the timing has moved into a stage where it’s being tested for follow-through.
Derivatives, though, are more worth watching.
24-hour trading volume is $276 million—volume is there—but open interest is $38.49 million, which actually shrank 3.8% over the past 24 hours.
Price is up, but open interest is down, suggesting this is more like a battle of existing liquidity rather than new leverage pushing the move.
Funding rate +0.0035%, long accounts 59%, sentiment leaning bullish; but the buy/sell ratio of 0.94 is right there—bulls on the mouth, selling with their hands. The divergence is notable.
Don’t listen to stories—look at the data.
For the bearish attention zone, start with 0.12397 - 0.12437. It’s more suitable to wait for a retest and pressure confirmation, not to make a short call directly at the current price.
If that range holds down, the bearish logic continues to stand. If it’s able to take out 0.12499 on volume, and that invalidation reference level is breached, then the bearish thesis is basically over—don’t stubbornly hold on.
For the downside extension, watch around 0.1048; if it breaks down on volume, then look again at support near 0.10422.
All the conditions are laid out—trigger it, then act; don’t rush into it.
Let me put it bluntly: right now there isn’t any particularly clear reverse signal that can directly overturn this view. Supertrend and MACD are still on the bullish side—this kind of disagreement has to be faced. If the pressure zone can’t hold, the bearish logic won’t be able to stand.
The market won’t lie, but it also doesn’t guarantee direction. The contract leverage itself is risk.
One more thing: I’m holding this in my live trading—$FOGO long. I continue to look bullish on this setup; my position and my view are aligned.
For reference only and not investment advice. Contracts have leverage, and investing involves risk.
This article was generated with the help of Musk’s xAI large model Grok.
$ARB
#Contract View
$ARB Bearish | Pushing down 0.12397 - 0.12437 | Moved past after going above 0.12499 | Watch 0.1048
$ARB In this wave, I’m bearish.
Over the past 24 hours it’s up 14.23%, reaching 0.12397—looks fierce at first glance, but the order book is already sending cooling signals.
RSI 70.9, clearly in an overheated zone; the buy/sell ratio is 0.94 on the order flow—sell-side is actually stronger. Prices surge, but the people taking the bids are quietly selling.
From the structure: the recent high is 0.12499, the low is 0.10422—the rally has essentially consumed most of that range.
The Bollinger upper band is 0.1202, and the current price 0.12397 is already above the upper band. At this position, the probability of a continued one-way move isn’t high; historically it’s more common to see a pullback for confirmation.
The Supertrend is still rising, and MACD is also showing bullish momentum—structure hasn’t broken, but the timing has moved into a stage where it’s being tested for follow-through.
Derivatives, though, are more worth watching.
24-hour trading volume is $276 million—volume is there—but open interest is $38.49 million, which actually shrank 3.8% over the past 24 hours.
Price is up, but open interest is down, suggesting this is more like a battle of existing liquidity rather than new leverage pushing the move.
Funding rate +0.0035%, long accounts 59%, sentiment leaning bullish; but the buy/sell ratio of 0.94 is right there—bulls on the mouth, selling with their hands. The divergence is notable.
Don’t listen to stories—look at the data.
For the bearish attention zone, start with 0.12397 - 0.12437. It’s more suitable to wait for a retest and pressure confirmation, not to make a short call directly at the current price.
If that range holds down, the bearish logic continues to stand. If it’s able to take out 0.12499 on volume, and that invalidation reference level is breached, then the bearish thesis is basically over—don’t stubbornly hold on.
For the downside extension, watch around 0.1048; if it breaks down on volume, then look again at support near 0.10422.
All the conditions are laid out—trigger it, then act; don’t rush into it.
Let me put it bluntly: right now there isn’t any particularly clear reverse signal that can directly overturn this view. Supertrend and MACD are still on the bullish side—this kind of disagreement has to be faced. If the pressure zone can’t hold, the bearish logic won’t be able to stand.
The market won’t lie, but it also doesn’t guarantee direction. The contract leverage itself is risk.
One more thing: I’m holding this in my live trading—$FOGO long. I continue to look bullish on this setup; my position and my view are aligned.
For reference only and not investment advice. Contracts have leverage, and investing involves risk.
This article was generated with the help of Musk’s xAI large model Grok.
$ARB
#Contract View