$ETH Crypto-market academicians: Ethereum (ETH) gains of 9.3 are gradually losing momentum—how can the risk of this pullback be ignored? Latest market analysis for reference
As Ethereum’s current price is 2392, it is oscillating and falling. People who chase the price fear getting trapped at high levels right after entering, holders worry that the profits they have in hand will be quickly given back, and those in cash fear missing the next round of opportunities. The market is always like this: greedy when it rises, panicked when it falls. Instead of gambling on direction by instinct, it’s better to calm down and read the chart signals—plan support, resistance, and stop-loss levels clearly—so you’re not led around by market ups-and-down emotions. In the end, trading is not about occasional windfall profits; it’s about risk control and trading discipline.
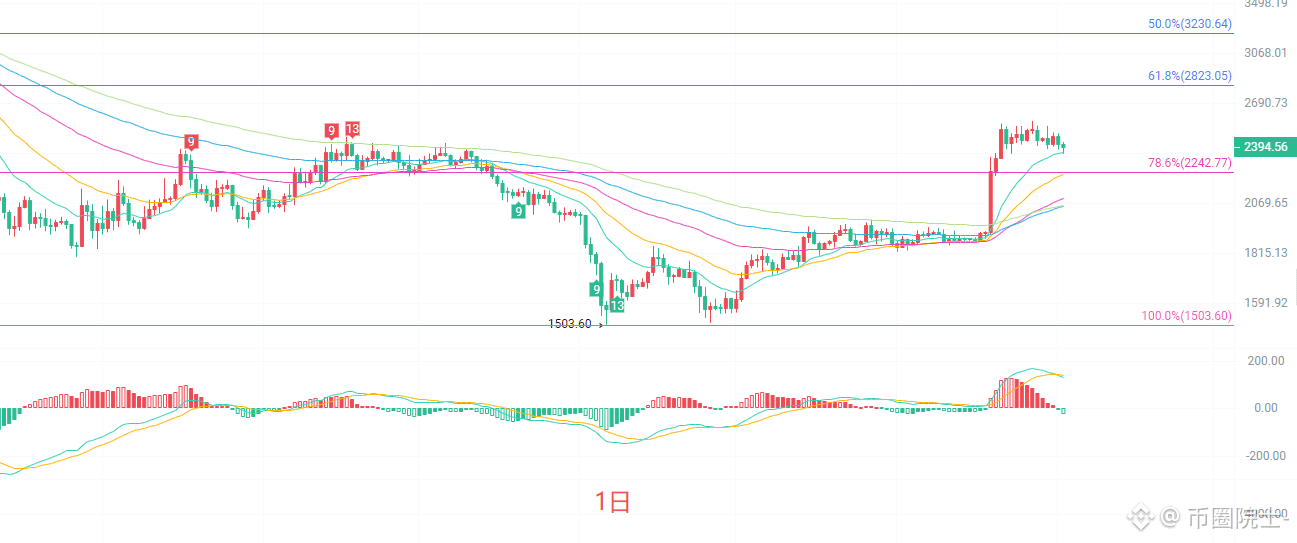
On the daily chart, price is currently retracing near the short-term moving averages. The EMA15 at 2363 has become an important short-term support level. The MACD’s bullish histogram continues to shrink; the DIF line is turning downward, and bullish momentum is being consumed step by step. After the Bollinger Bands widen, the upper band is under pressure, and price failed to hold above the upper band. The key overhead pressure lies in the 2440–2480 range—this is the resistance zone at the high of this rebound. The first support below is 2242, which corresponds to the 78.6% Fibonacci level. If this level is broken, the structure of this rebound will be damaged, and the market will open up further downside space for the pullback. The daily timeframe has already entered a critical window where bulls and bears are in a decisive battle.
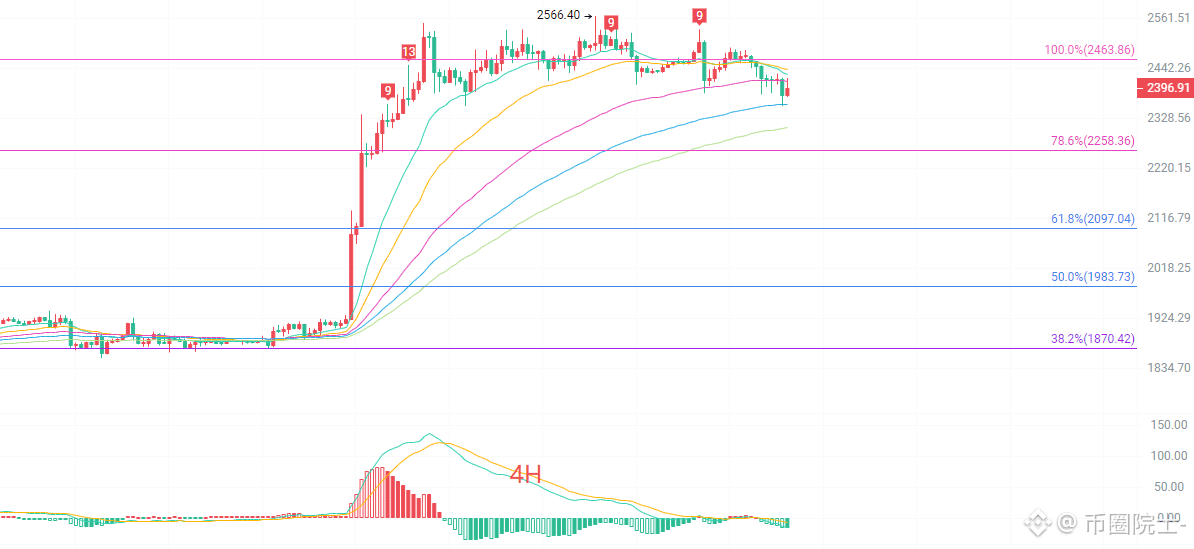
On the 4-hour chart, price has already broken below the EMA15 and EMA30 short-term moving averages, and the short-term trend has turned to a bearish bias. The moving-average cluster, which was previously fanning upward, is gradually curling and intertwining. The MACD continues to run below the zero axis, and bearish momentum remains released. The Bollinger Band middle line at 2442 forms strong resistance—multiple rebounds failed to stand effectively above it. The Fibonacci 78.6 level at 2258 is an important defensive support on the 4-hour timeframe. Current price is riding close to the lower Bollinger Band; there may be a possibility of a mild rebound to repair the moving averages in the short term. However, any rebound should be viewed more as an opportunity to sell short under pressure. Only by regaining stability above 2442 can the weak short-term pattern on the 4-hour chart be reversed; otherwise, after a rebound there remains risk of further downside.
Short-term references:
Do not lose the 2255–2265 area from below; set stop-loss at 40 points; target 2340–2380.
Do not lose the 2430–2445 area from above; set stop-loss at 40 points; target 2340–2300.
#ETH走势分析
As Ethereum’s current price is 2392, it is oscillating and falling. People who chase the price fear getting trapped at high levels right after entering, holders worry that the profits they have in hand will be quickly given back, and those in cash fear missing the next round of opportunities. The market is always like this: greedy when it rises, panicked when it falls. Instead of gambling on direction by instinct, it’s better to calm down and read the chart signals—plan support, resistance, and stop-loss levels clearly—so you’re not led around by market ups-and-down emotions. In the end, trading is not about occasional windfall profits; it’s about risk control and trading discipline.
On the daily chart, price is currently retracing near the short-term moving averages. The EMA15 at 2363 has become an important short-term support level. The MACD’s bullish histogram continues to shrink; the DIF line is turning downward, and bullish momentum is being consumed step by step. After the Bollinger Bands widen, the upper band is under pressure, and price failed to hold above the upper band. The key overhead pressure lies in the 2440–2480 range—this is the resistance zone at the high of this rebound. The first support below is 2242, which corresponds to the 78.6% Fibonacci level. If this level is broken, the structure of this rebound will be damaged, and the market will open up further downside space for the pullback. The daily timeframe has already entered a critical window where bulls and bears are in a decisive battle.
On the 4-hour chart, price has already broken below the EMA15 and EMA30 short-term moving averages, and the short-term trend has turned to a bearish bias. The moving-average cluster, which was previously fanning upward, is gradually curling and intertwining. The MACD continues to run below the zero axis, and bearish momentum remains released. The Bollinger Band middle line at 2442 forms strong resistance—multiple rebounds failed to stand effectively above it. The Fibonacci 78.6 level at 2258 is an important defensive support on the 4-hour timeframe. Current price is riding close to the lower Bollinger Band; there may be a possibility of a mild rebound to repair the moving averages in the short term. However, any rebound should be viewed more as an opportunity to sell short under pressure. Only by regaining stability above 2442 can the weak short-term pattern on the 4-hour chart be reversed; otherwise, after a rebound there remains risk of further downside.
Short-term references:
Do not lose the 2255–2265 area from below; set stop-loss at 40 points; target 2340–2380.
Do not lose the 2430–2445 area from above; set stop-loss at 40 points; target 2340–2300.
#ETH走势分析