$BTC Crypto Scholars: Bitcoin (BTC) 9.3 Washout Trap Is Unfolding—Uncovering the Underlying Truth Behind the Long vs. Short Power Struggle in Bitcoin Trading? Latest Market Analysis and Trading Operation Suggestions
Bitcoin’s current price is 78750. The chart keeps pulling back and pushing forward, and the long-vs-short battle is extremely fierce. Watching the price jump up and down, many people keep getting swept and forced to cut losses, becoming increasingly hesitant in their actions. In a bull market, the biggest fear is chasing and killing—buying high and selling low—because the trend doesn’t move one direction upward forever. Midway pullbacks and washouts are normal. Don’t let short-term price swings disrupt your mindset. Understand the structure, protect your position, and set your stop-loss—this matters far more than trading back and forth frequently. Around 77000 right now, is this a pullback that gathers strength, or a top followed by a retreat? Technical signals have already provided some clues. We objectively break down the current situation by analyzing the order flow.
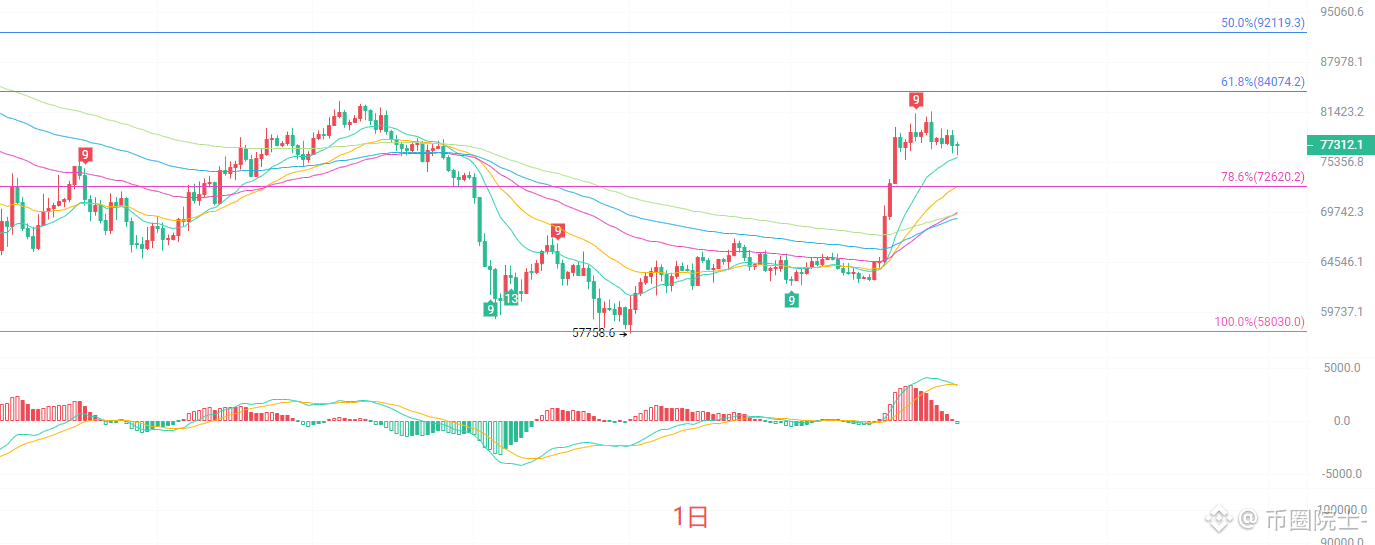
On the daily (D1) candlestick chart, price has held above the EMA15 and EMA30 moving averages. The medium- and long-term moving averages are still pointing upward, and the overall bull structure has not been fully broken. The 78.6% Fibonacci level at 72620 forms a key support, while the strong overhead pressure is at 84074. The MACD histogram’s red bars continue to shrink. The DIF line appears to be turning downward, approaching DEA—suggesting that bullish momentum is gradually fading. The Bollinger Bands have tightened slightly. Price has pulled back from the upper band and is now moving above the middle band. On the daily chart, it’s a high-range consolidation pattern after an upmove. There’s no clear reversal signal yet, but the momentum for further upside breakout is lacking. Most likely, the price will repeatedly test the downside supports and wait for a directional choice.
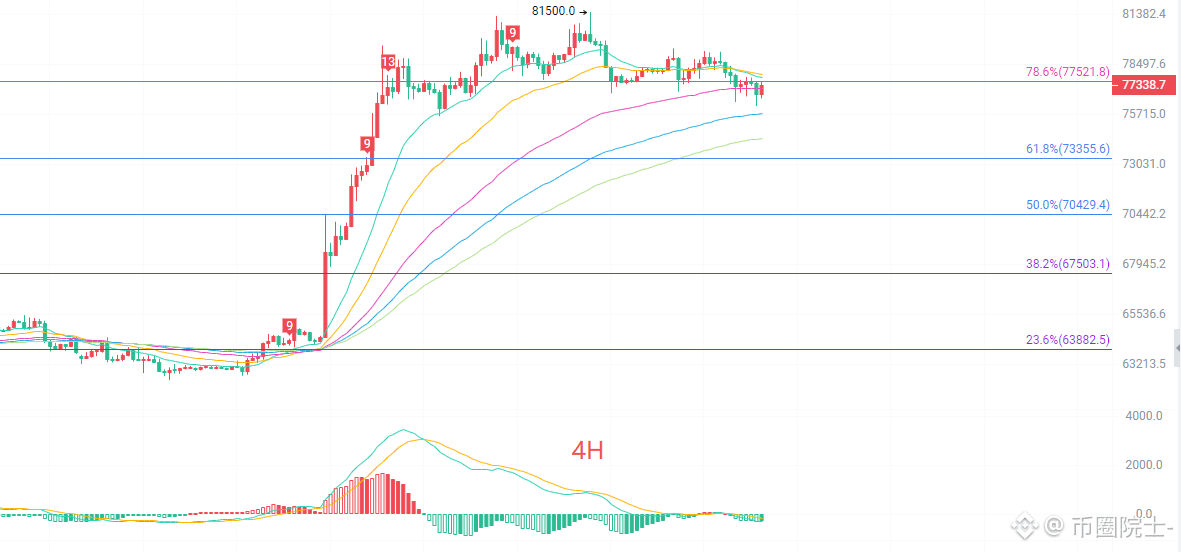
On the four-hour (H4) candlestick chart, price has fallen to below the EMA15 moving average. The short-term moving averages are beginning to flatten, and the bullish strength from shorter cycles is weakening. The key overhead resistance is 82828. The 78.6% Fibonacci level at 77521 is very close to the current price and may act as near-term suppression. The first support below is 73355, and further strong support lies at 70429. The H4 MACD is already above the zero line, and the red histogram is nearly exhausted, with potential risk of forming a dead cross. The Bollinger Bands have shifted from expansion to contraction, and price is oscillating around the middle band. The H4 timeframe is in a high-level pullback and consolidation phase. Near term, it leans toward consolidation with weakness. If price cannot reclaim and hold above 77521, it may continue to move downward to retest the support zone.
Short-term reference:
Buy-side expectation: From 74000 to 73400 northward; stop-loss 500 points; targets 77500 to 80000.
Sell-side expectation: From 77500 to 78200 southward; stop-loss 500 points; targets 76500 to 75500
#BTC走势分析
Bitcoin’s current price is 78750. The chart keeps pulling back and pushing forward, and the long-vs-short battle is extremely fierce. Watching the price jump up and down, many people keep getting swept and forced to cut losses, becoming increasingly hesitant in their actions. In a bull market, the biggest fear is chasing and killing—buying high and selling low—because the trend doesn’t move one direction upward forever. Midway pullbacks and washouts are normal. Don’t let short-term price swings disrupt your mindset. Understand the structure, protect your position, and set your stop-loss—this matters far more than trading back and forth frequently. Around 77000 right now, is this a pullback that gathers strength, or a top followed by a retreat? Technical signals have already provided some clues. We objectively break down the current situation by analyzing the order flow.
On the daily (D1) candlestick chart, price has held above the EMA15 and EMA30 moving averages. The medium- and long-term moving averages are still pointing upward, and the overall bull structure has not been fully broken. The 78.6% Fibonacci level at 72620 forms a key support, while the strong overhead pressure is at 84074. The MACD histogram’s red bars continue to shrink. The DIF line appears to be turning downward, approaching DEA—suggesting that bullish momentum is gradually fading. The Bollinger Bands have tightened slightly. Price has pulled back from the upper band and is now moving above the middle band. On the daily chart, it’s a high-range consolidation pattern after an upmove. There’s no clear reversal signal yet, but the momentum for further upside breakout is lacking. Most likely, the price will repeatedly test the downside supports and wait for a directional choice.
On the four-hour (H4) candlestick chart, price has fallen to below the EMA15 moving average. The short-term moving averages are beginning to flatten, and the bullish strength from shorter cycles is weakening. The key overhead resistance is 82828. The 78.6% Fibonacci level at 77521 is very close to the current price and may act as near-term suppression. The first support below is 73355, and further strong support lies at 70429. The H4 MACD is already above the zero line, and the red histogram is nearly exhausted, with potential risk of forming a dead cross. The Bollinger Bands have shifted from expansion to contraction, and price is oscillating around the middle band. The H4 timeframe is in a high-level pullback and consolidation phase. Near term, it leans toward consolidation with weakness. If price cannot reclaim and hold above 77521, it may continue to move downward to retest the support zone.
Short-term reference:
Buy-side expectation: From 74000 to 73400 northward; stop-loss 500 points; targets 77500 to 80000.
Sell-side expectation: From 77500 to 78200 southward; stop-loss 500 points; targets 76500 to 75500
#BTC走势分析