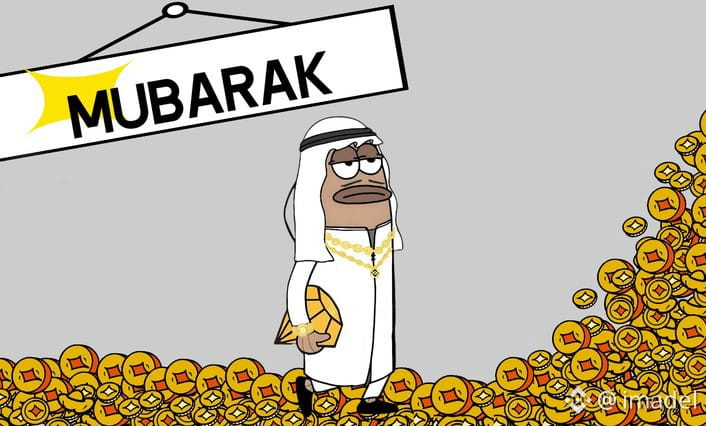
$MUBARAK MUBARAK coin continues its activity within the horizontal accumulation range during today’s trading (September 2, 2026). The ticker shows holding around technical support levels amid a steady balance between collective buy inflows and price-calming moves.
Market data and financial performance today (September 2, 2026)
Index Value / Status (September 2, 2026) Price range $0.0198 – $0.0215
Change over 24 hours Relative stability (+1.2% to +2.5%)
Daily trading activity Steady trades around $3.8M – $4.2M
Market cap ~ $20.8M – $22.2M
Key support levels $0.0188 – $0.0192
Near resistance levels $0.0225 – $0.0240
Technical analysis and today’s price behavior
The price structure of MUBARAK on the daily timeframe shows notable consolidation above the key pivot support level at $0.0192, with repeated attempts to build a higher price base above the Simple Moving Average (SMA 20).
Relative Strength Index (RSI 14): It moves near the balanced level at 52, reflecting neutrality between buying and selling forces and giving the price flexibility to move in either direction based on liquidity changes.
Resistance test: The main trading obstacle remains the $0.0225 – $0.0240 range; breaking above it requires a significant increase in trade volume to close a confirmed daily candle.
$MUBARAK #MUBARAK #BinanceArabic #Scalping #CryptoSignals #تحليل_فني #توصيات_كريبتو #MUBARAKUSDT #MUBARAK #CryptoAlpha #Wh
Market data and financial performance today (September 2, 2026)
Index Value / Status (September 2, 2026) Price range $0.0198 – $0.0215
Change over 24 hours Relative stability (+1.2% to +2.5%)
Daily trading activity Steady trades around $3.8M – $4.2M
Market cap ~ $20.8M – $22.2M
Key support levels $0.0188 – $0.0192
Near resistance levels $0.0225 – $0.0240
Technical analysis and today’s price behavior
The price structure of MUBARAK on the daily timeframe shows notable consolidation above the key pivot support level at $0.0192, with repeated attempts to build a higher price base above the Simple Moving Average (SMA 20).
Relative Strength Index (RSI 14): It moves near the balanced level at 52, reflecting neutrality between buying and selling forces and giving the price flexibility to move in either direction based on liquidity changes.
Resistance test: The main trading obstacle remains the $0.0225 – $0.0240 range; breaking above it requires a significant increase in trade volume to close a confirmed daily candle.
$MUBARAK #MUBARAK #BinanceArabic #Scalping #CryptoSignals #تحليل_فني #توصيات_كريبتو #MUBARAKUSDT #MUBARAK #CryptoAlpha #Wh