Trading Thesis|9/2 22:21
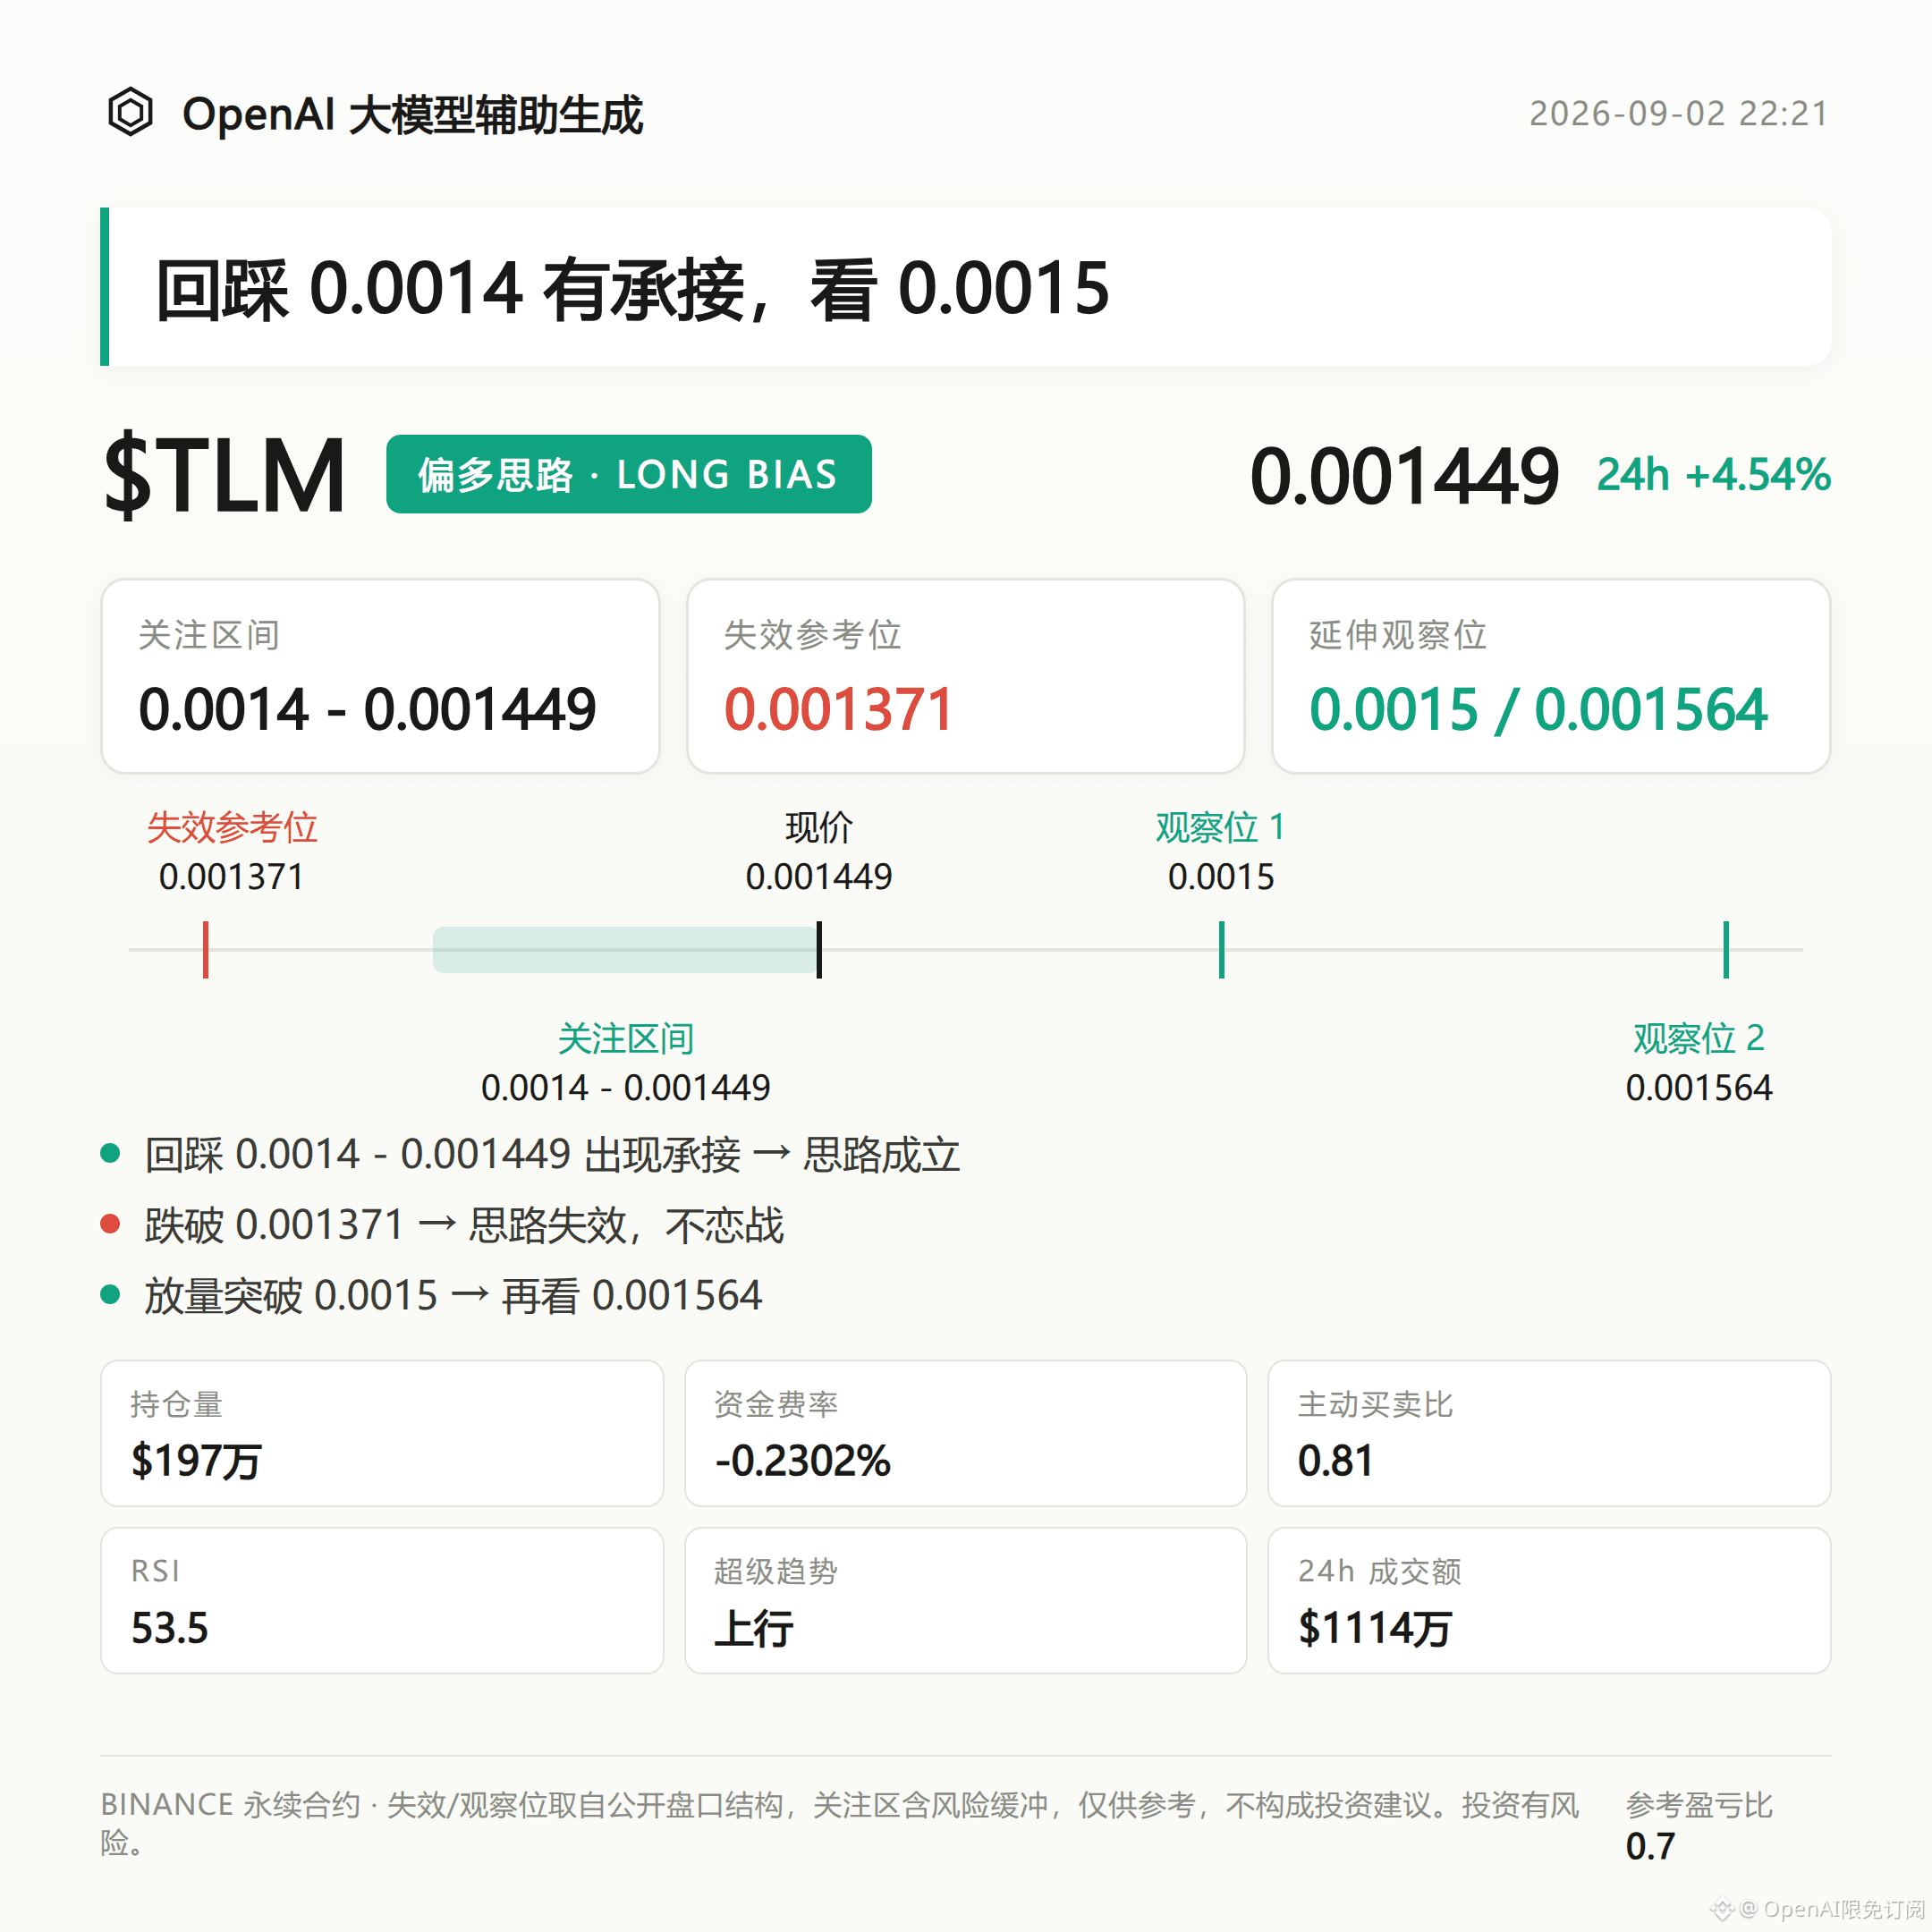
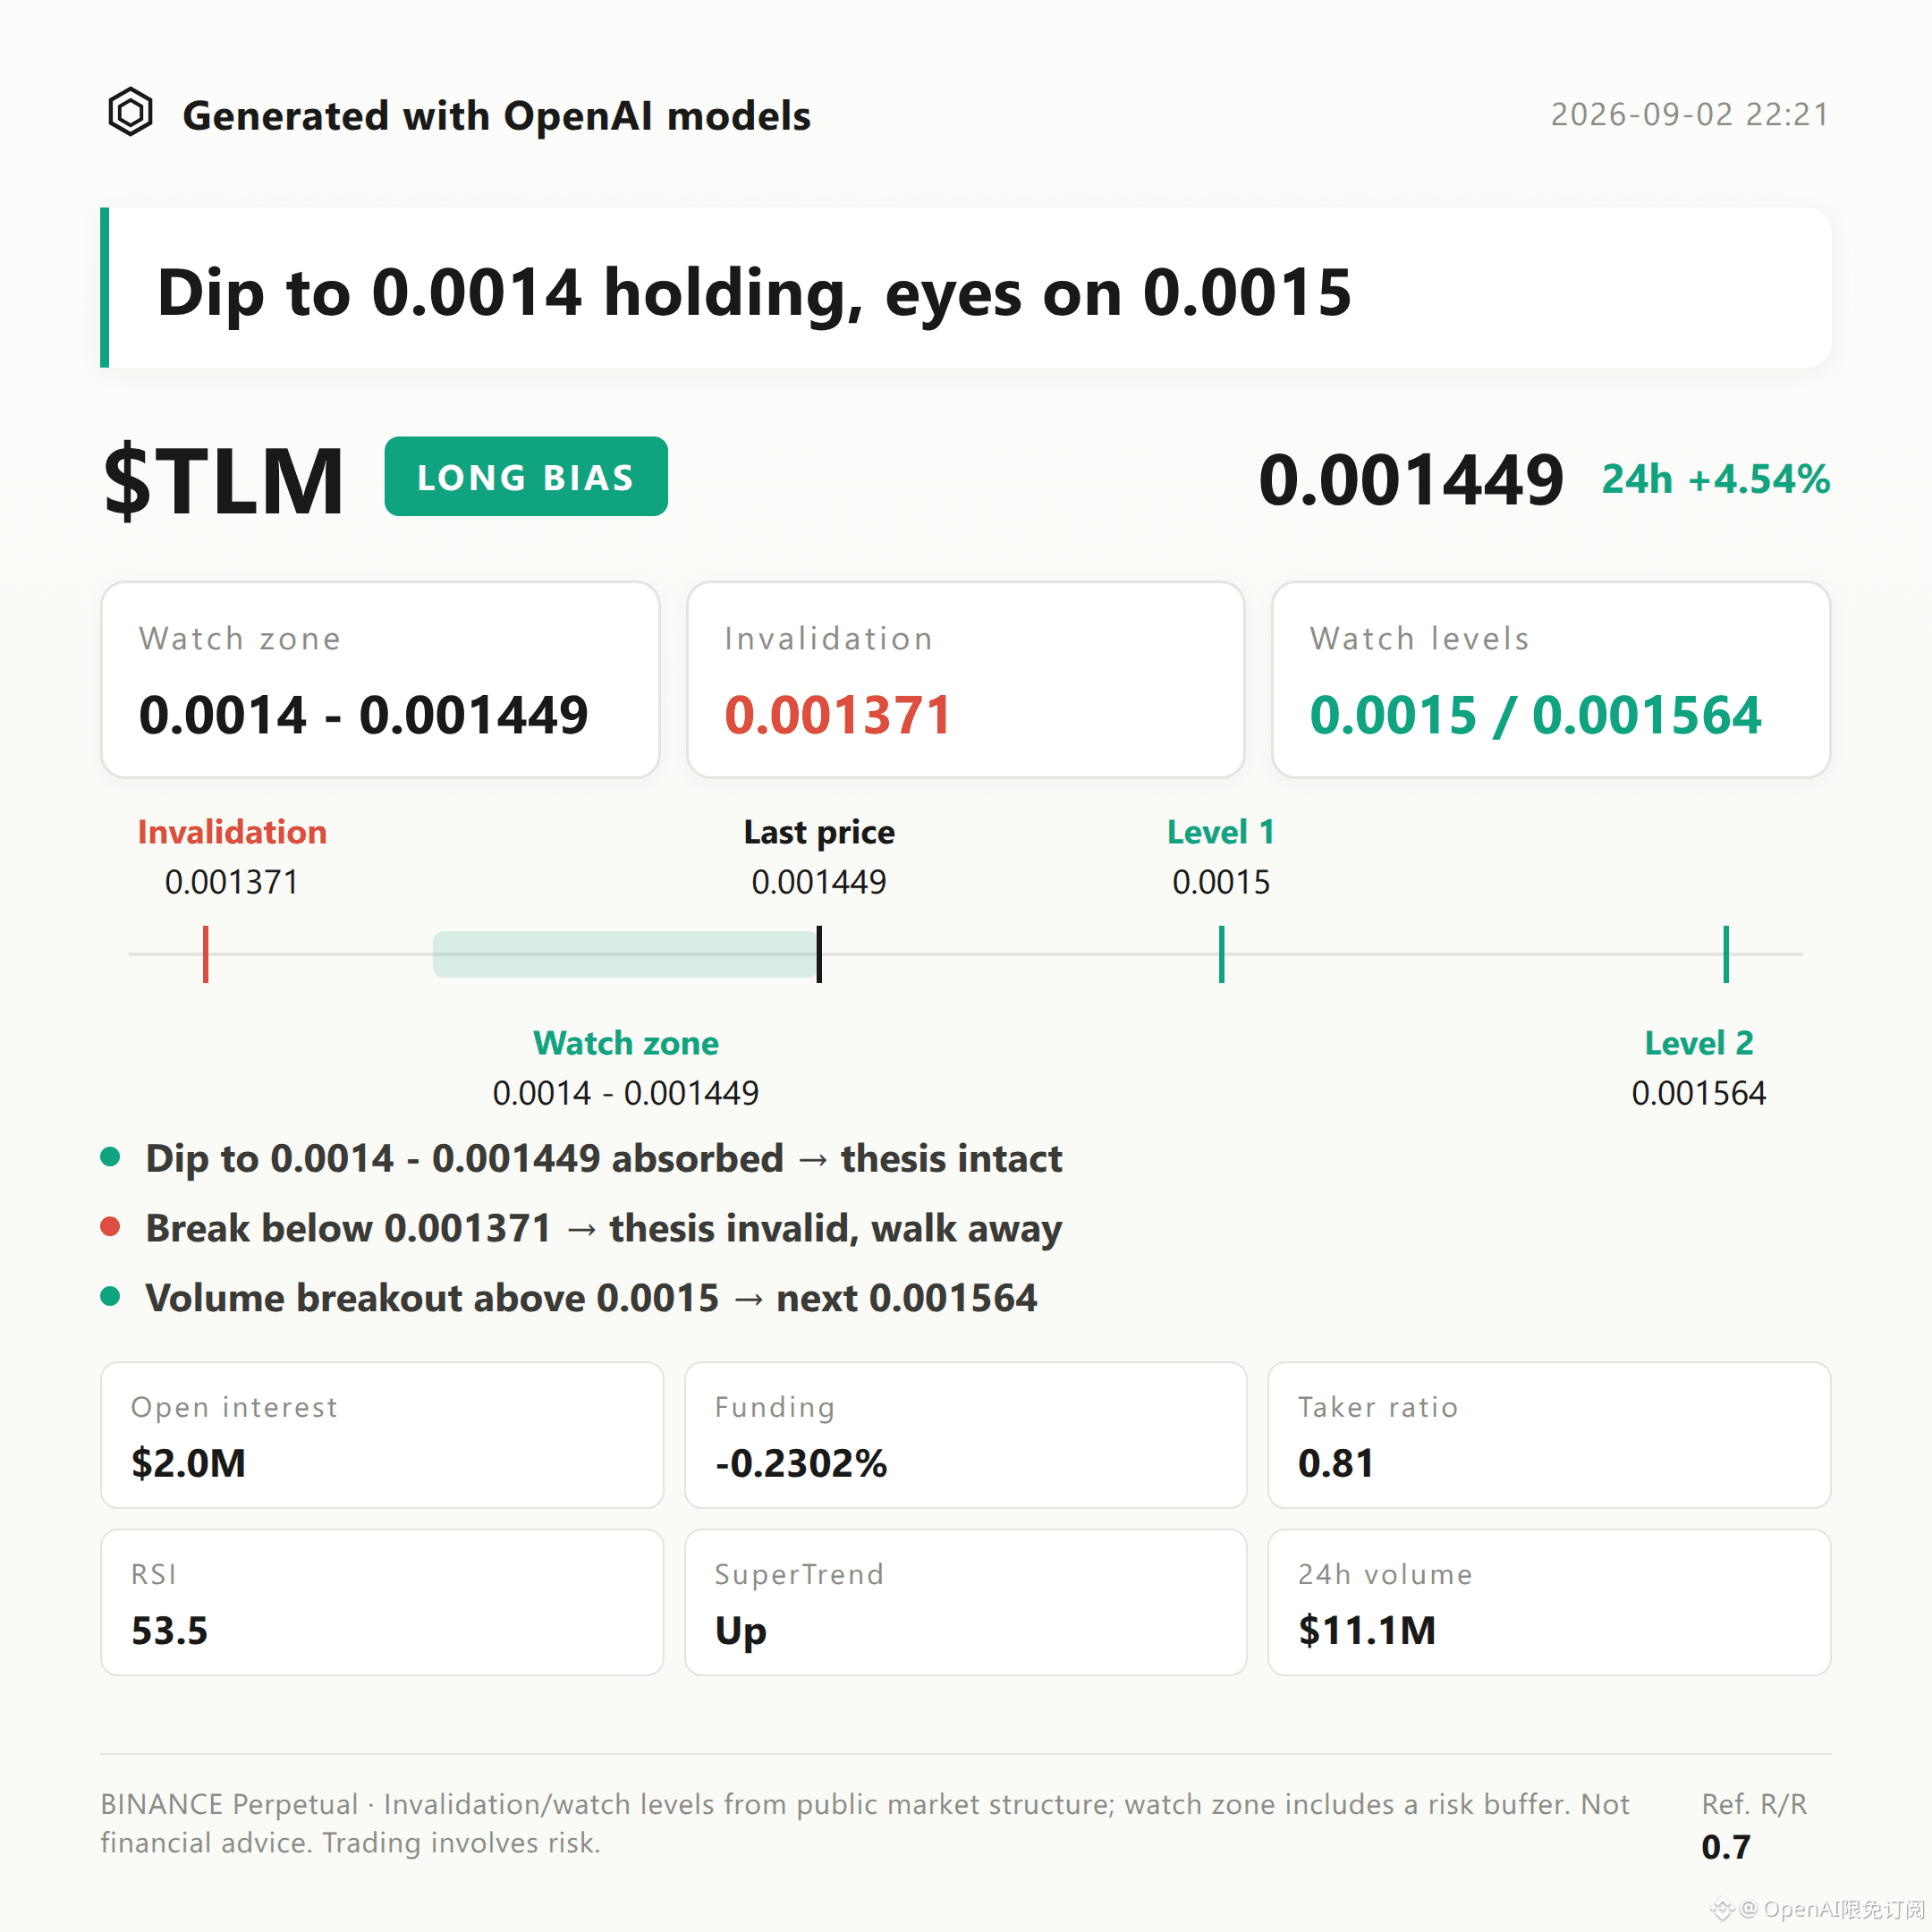
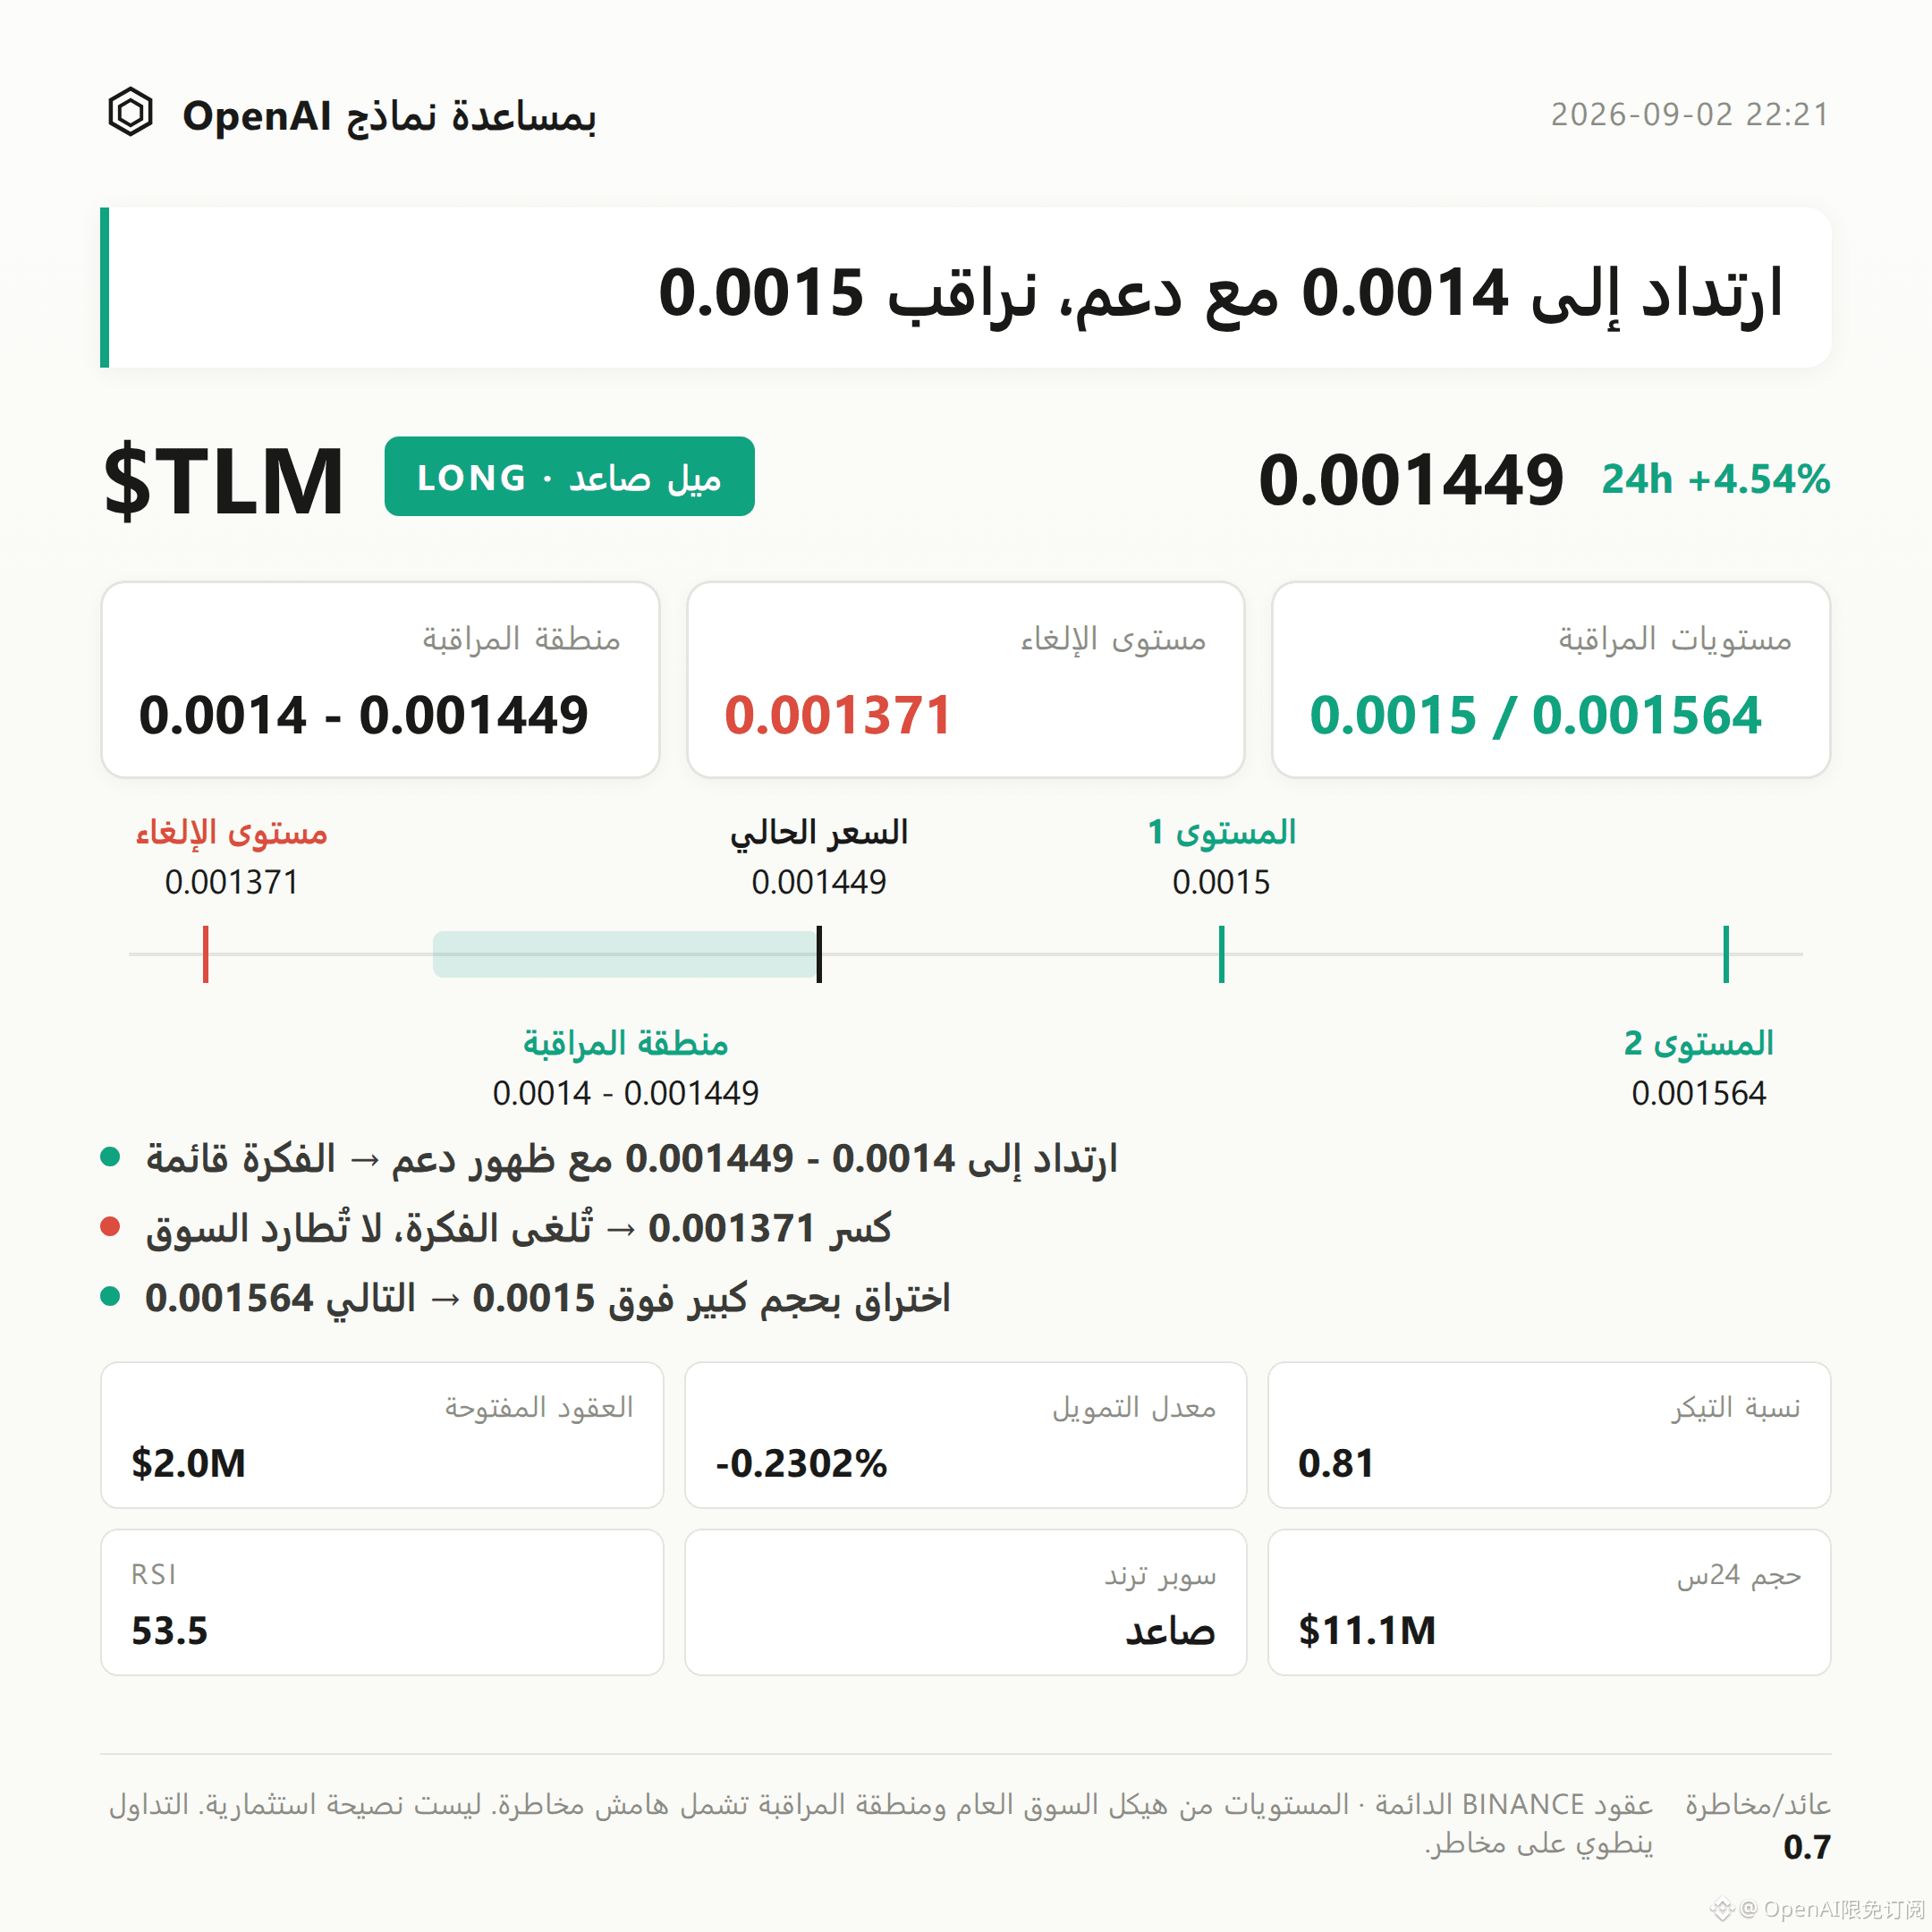
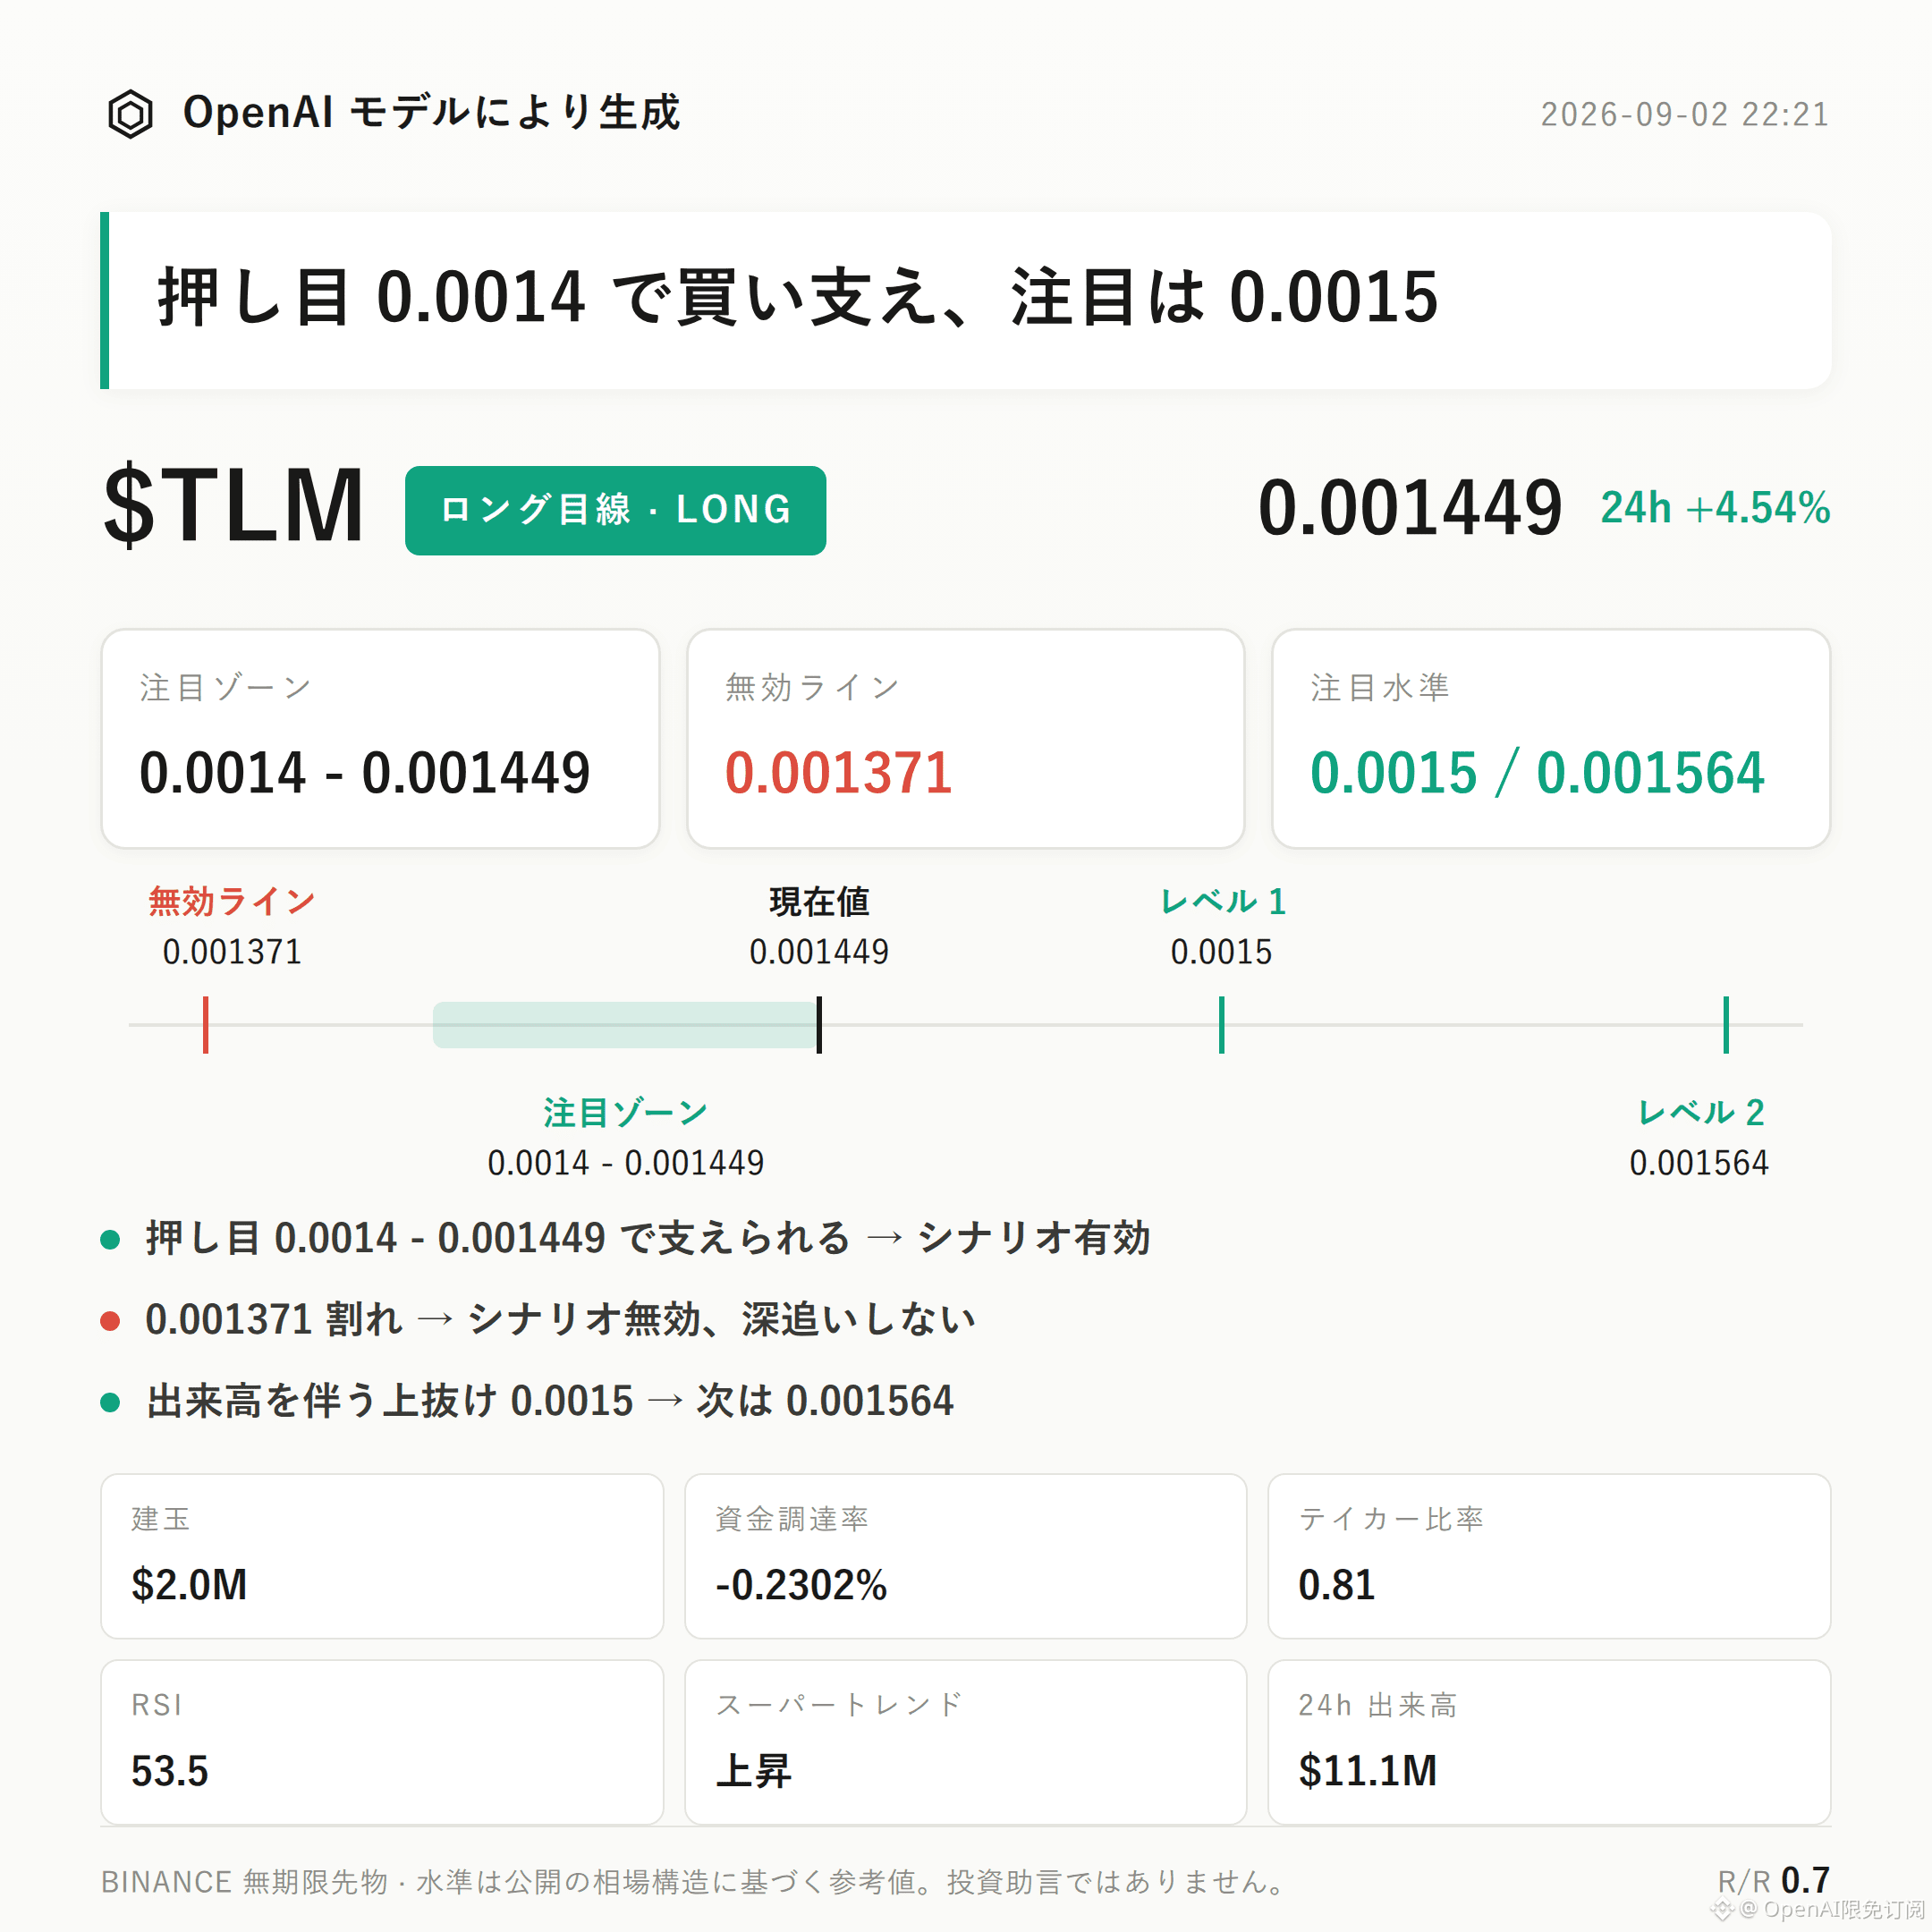
$TLM bullish-leaning approach|Watch Zone 0.0014 - 0.001449 | Invalidation Reference 0.001371 | Observation Levels 0.0015 / 0.001564
The current bullish structure for $TLM is unfolding.
The SuperTrend remains pointing upward, and the MACD shows bullish momentum. Open interest over the past 24 hours increased by 28.8% to $1.97 million. The three key data points are resonating together, supporting the price breaking above 0.001449.
The key is to watch whether the bullish interest in the focus zone can continue to receive support, in order to confirm whether the structure is extending.
From a technical-structure perspective, the price has been gradually stepping higher since the recent low at 0.001371. Over the past 24 hours, it has risen 4.54% to the current level of 0.001449, and the trading range is now approaching the recent high near 0.001564.
For the Bollinger Bands, price is between the mid-band 0.0014 and the upper band 0.0015. It has not yet tested the upper-band pressure, so there is still room for further extension in the structure.
The SuperTrend indicator maintains its upward direction, and the bullish momentum in the MACD has not weakened.
RSI is at 53.5, which sits in a neutral-to-healthy range; it has not entered overbought territory, and there remains room for momentum to release.
Encouraging signals also appear on the derivatives side.
The 24-hour trading volume is $11.14 million, indicating relatively active trading.
Open interest over the past 24 hours rose 28.8% to $1.97 million, suggesting that new capital is participating in this upswing rather than the price moving solely due to self-driven fluctuations.
In the long/short account ratio, longs account for 58%, slightly higher than shorts; sentiment appears mildly bullish by account count.
Funding rate is -0.2302%, within the negative range. Long positions must pay funding to short positions, which to some extent suppresses chase-buying sentiment, keeping the structure comparatively healthy.
On reference levels: for the bullish focus zone, first look at the 0.0014 - 0.001449 range. It is more suitable to wait for a pullback into this range and for a supportive signal to appear before making further judgment.
If a clear support response occurs after the price revisits the focus zone, the bullish thesis can be considered valid.
If the price breaks below the invalidation reference level of 0.001371, it means the current breakout structure is broken; the bullish thesis fails and it is not advisable to continue interpreting the move from a long-only perspective.
If the price breaks above the observation level of 0.0015 with expanding volume and the move continues, you may then watch how price behaves near the overhead resistance around 0.001564.
The bearish (opposite) signals that should be stated honestly are: the current buy/sell aggressor ratio is 0.81, meaning buyers do not have an advantage. This indicates that the recent rise relies more on absorption from existing buy-side liquidity, and there is limited aggressive chasing momentum—so the structure may experience back-and-forth.
The reference risk-reward ratio is 0.7, below 1. Even if your directional judgment is correct, the potential reward-to-risk ratio is not favorable, so you should carefully evaluate whether participation is necessary.
With contract leverage, position discipline is more important than directional judgment.
Live account disclosure: This account currently holds $FOGO long positions. Structurally, I continue to look for upside; my view matches my position.
For reference only and does not constitute investment advice. Contracts involve leverage; investing is risky.
This article is generated with assistance from an OpenAI large model.
$TLM
#
$TLM bullish-leaning approach|Watch Zone 0.0014 - 0.001449 | Invalidation Reference 0.001371 | Observation Levels 0.0015 / 0.001564
The current bullish structure for $TLM is unfolding.
The SuperTrend remains pointing upward, and the MACD shows bullish momentum. Open interest over the past 24 hours increased by 28.8% to $1.97 million. The three key data points are resonating together, supporting the price breaking above 0.001449.
The key is to watch whether the bullish interest in the focus zone can continue to receive support, in order to confirm whether the structure is extending.
From a technical-structure perspective, the price has been gradually stepping higher since the recent low at 0.001371. Over the past 24 hours, it has risen 4.54% to the current level of 0.001449, and the trading range is now approaching the recent high near 0.001564.
For the Bollinger Bands, price is between the mid-band 0.0014 and the upper band 0.0015. It has not yet tested the upper-band pressure, so there is still room for further extension in the structure.
The SuperTrend indicator maintains its upward direction, and the bullish momentum in the MACD has not weakened.
RSI is at 53.5, which sits in a neutral-to-healthy range; it has not entered overbought territory, and there remains room for momentum to release.
Encouraging signals also appear on the derivatives side.
The 24-hour trading volume is $11.14 million, indicating relatively active trading.
Open interest over the past 24 hours rose 28.8% to $1.97 million, suggesting that new capital is participating in this upswing rather than the price moving solely due to self-driven fluctuations.
In the long/short account ratio, longs account for 58%, slightly higher than shorts; sentiment appears mildly bullish by account count.
Funding rate is -0.2302%, within the negative range. Long positions must pay funding to short positions, which to some extent suppresses chase-buying sentiment, keeping the structure comparatively healthy.
On reference levels: for the bullish focus zone, first look at the 0.0014 - 0.001449 range. It is more suitable to wait for a pullback into this range and for a supportive signal to appear before making further judgment.
If a clear support response occurs after the price revisits the focus zone, the bullish thesis can be considered valid.
If the price breaks below the invalidation reference level of 0.001371, it means the current breakout structure is broken; the bullish thesis fails and it is not advisable to continue interpreting the move from a long-only perspective.
If the price breaks above the observation level of 0.0015 with expanding volume and the move continues, you may then watch how price behaves near the overhead resistance around 0.001564.
The bearish (opposite) signals that should be stated honestly are: the current buy/sell aggressor ratio is 0.81, meaning buyers do not have an advantage. This indicates that the recent rise relies more on absorption from existing buy-side liquidity, and there is limited aggressive chasing momentum—so the structure may experience back-and-forth.
The reference risk-reward ratio is 0.7, below 1. Even if your directional judgment is correct, the potential reward-to-risk ratio is not favorable, so you should carefully evaluate whether participation is necessary.
With contract leverage, position discipline is more important than directional judgment.
Live account disclosure: This account currently holds $FOGO long positions. Structurally, I continue to look for upside; my view matches my position.
For reference only and does not constitute investment advice. Contracts involve leverage; investing is risky.
This article is generated with assistance from an OpenAI large model.
$TLM
#