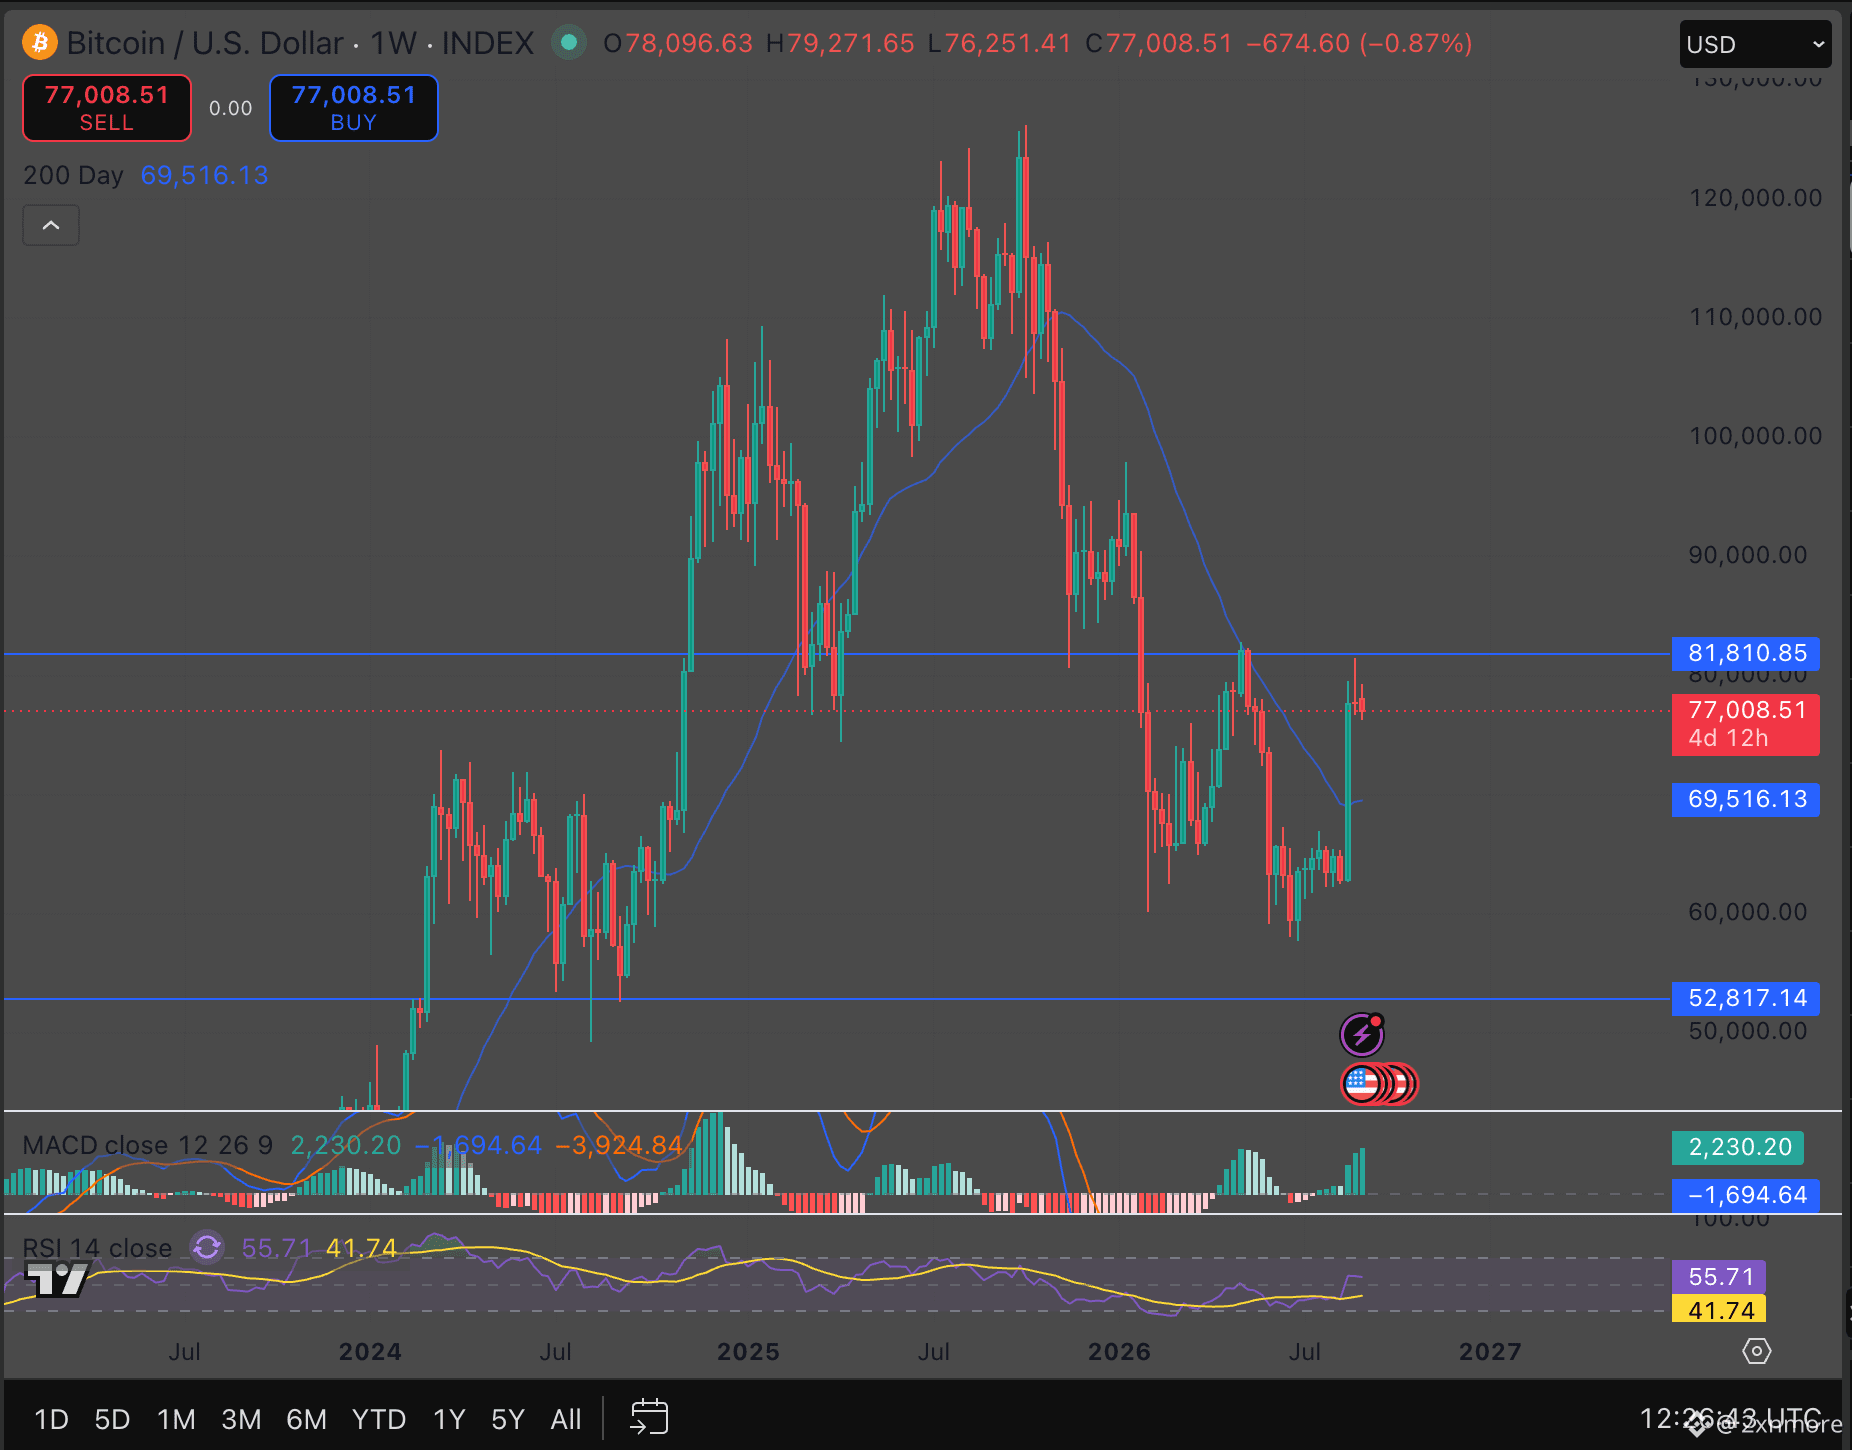
$BTC weekly closed at 77,008.51, down 0.87% on the week, after the biggest green candle on this chart tagged resistance and got rejected.
One level actually matters here.
Resistance to reclaim: 81,810.85
Price tried to break above it recently, printed a long upper wick right at that line, and has pulled back since.
Until BTC closes a week above that number, this is a retest, not a breakout.
Support to defend: 69,516.13
That is the 200 day moving average, and price is holding above it right now.
This is the level that needs to hold for the recovery case to stay alive.
Deeper structural floor: 52,817.14
Nowhere near price right now, but it is the line where the entire bull case would be in real question if it ever traded there again.
Momentum leans bullish for now. MACD, 12, 26, 9, is back to green histogram bars, fast line reading 2,230.20.
RSI 14 shows 55.71 against its 41.74 moving average, the faster line already back above the midline.
None of that guarantees the level breaks.
Reclaim 81,810.85 on a weekly close, and this turns into a real breakout.
Lose 69,516.13 on a weekly close, and the recovery story is what is in question, not the resistance.
One level actually matters here.
Resistance to reclaim: 81,810.85
Price tried to break above it recently, printed a long upper wick right at that line, and has pulled back since.
Until BTC closes a week above that number, this is a retest, not a breakout.
Support to defend: 69,516.13
That is the 200 day moving average, and price is holding above it right now.
This is the level that needs to hold for the recovery case to stay alive.
Deeper structural floor: 52,817.14
Nowhere near price right now, but it is the line where the entire bull case would be in real question if it ever traded there again.
Momentum leans bullish for now. MACD, 12, 26, 9, is back to green histogram bars, fast line reading 2,230.20.
RSI 14 shows 55.71 against its 41.74 moving average, the faster line already back above the midline.
None of that guarantees the level breaks.
Reclaim 81,810.85 on a weekly close, and this turns into a real breakout.
Lose 69,516.13 on a weekly close, and the recovery story is what is in question, not the resistance.