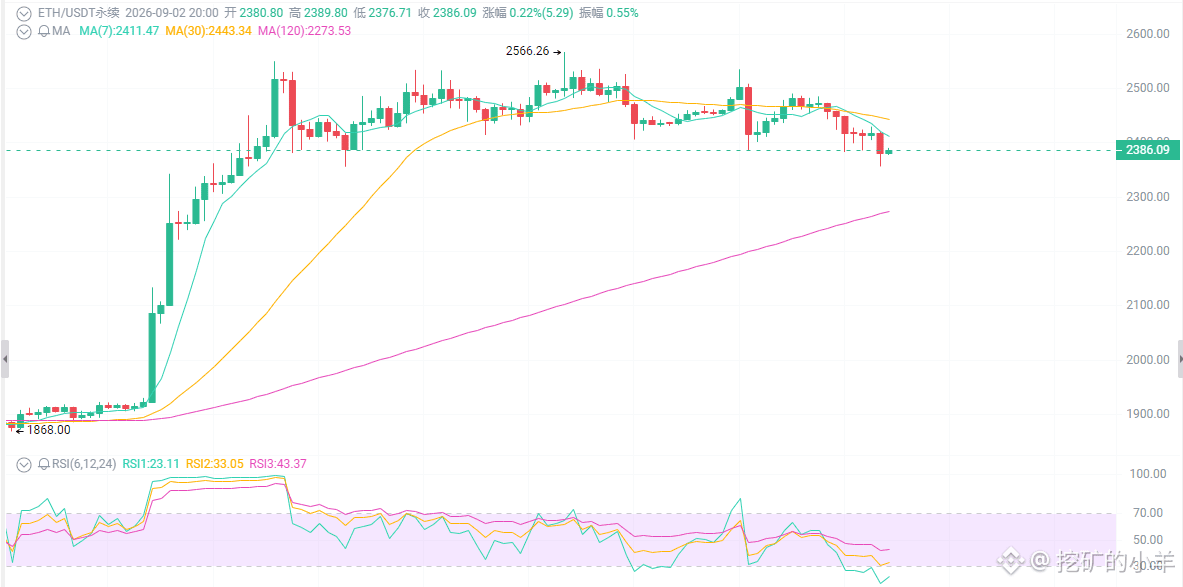
$2,380 ETH—are you bargain-hunting or running away?
First, look at the surface: a geopolitical conflict is dragging risk assets down together.
Today’s dominant factor isn’t anything going wrong on the ETH chain—it’s that the U.S. and Iran have started fighting again. Oil rises above $95, U.S. Treasury yields touch 4.81%, and risk assets all pull back. ETH falls with BTC, but its drop is smaller than SOL’s. That’s actually a decent sign: it’s dropping less than the rest.
On the weekly chart, it’s still holding above the breakout level. On the daily chart, it’s already probed down toward the lower edge of the flag pattern. Once 2438 is lost, the next question is whether 2350 can hold.
First thing: today’s drop isn’t because ETH is weak—it’s the macro dumping pressure
The main funds moved from 1,850 in August to 2,550, up nearly 40%. Now the pullback to 2,380 is down less than 7%.
But what really tightens the market is three words: “another rate hike.”
On September 16th’s FOMC, the market has already priced “a rate hike” at 35%-68%. As oil rises and inflation expectations heat up, the market quickly shifts “no change in September” toward “maybe one more hike.” With the Non-Farm Payrolls, CPI, and FOMC all clustered in the first two weeks of September, ETH isn’t pricing an upgrade right now—it’s pricing whether it will get “one more rate hike.”
Second thing: staking is locked up, big players are accumulating, retail is cutting losses
Staking rate is 35%. There’s a queue of 2.07 million ETH entering, waiting 36 days, and the exit queue is close to zero. Those who want to stake are still lining up; those who don’t want to exit at scale aren’t doing so.
ETF net assets are $15.2 billion, about 5.2% of ETH’s market cap. In August, inflows were $1.85 billion. BitMine continues adding; in August, big whales net increased by 430,000 ETH.
But staking yields are only 2.6%—lower than short-term U.S. Treasuries. It’s not really “driven by yield”; it looks more like long-term capital locking in inventory.
Third thing: the candlestick chart tells you—2,380 is the battlefield, not that the outcome is already decided
Weekly structure: the big bullish move in August broke through the descending trendline that began after the 2025 highs. The retest of the key level is the 0.618 Fibonacci level = 2,438. Now 2,380 is already slightly below that area, and this week’s close is extremely important.
Trading strategy
Scenario A: hold 2,350–2,380
Wait for a volume-backed stop of the selloff and a close with a lower wick. Then try a small long position. Stop-loss: 2,345–2,350. Targets: 2,420–2,450 → 2,480–2,520.
Scenario B: break below 2,350 and the rebound fails
On a rebound of 2,360–2,380, cut longs/refrain from new longs. Next buy zone: 2,280–2,220. If it gets worse: 2,050–2,000.
Scenario C: reclaim 2,438 and get a daily close solidly above it
Pull back 2,438–2,450 and go long for the medium term. Targets: 2,550 → 2,780 → 2,920. Until it holds, 2,550 is treated as resistance—not a breakout.
First, look at the surface: a geopolitical conflict is dragging risk assets down together.
Today’s dominant factor isn’t anything going wrong on the ETH chain—it’s that the U.S. and Iran have started fighting again. Oil rises above $95, U.S. Treasury yields touch 4.81%, and risk assets all pull back. ETH falls with BTC, but its drop is smaller than SOL’s. That’s actually a decent sign: it’s dropping less than the rest.
On the weekly chart, it’s still holding above the breakout level. On the daily chart, it’s already probed down toward the lower edge of the flag pattern. Once 2438 is lost, the next question is whether 2350 can hold.
First thing: today’s drop isn’t because ETH is weak—it’s the macro dumping pressure
The main funds moved from 1,850 in August to 2,550, up nearly 40%. Now the pullback to 2,380 is down less than 7%.
But what really tightens the market is three words: “another rate hike.”
On September 16th’s FOMC, the market has already priced “a rate hike” at 35%-68%. As oil rises and inflation expectations heat up, the market quickly shifts “no change in September” toward “maybe one more hike.” With the Non-Farm Payrolls, CPI, and FOMC all clustered in the first two weeks of September, ETH isn’t pricing an upgrade right now—it’s pricing whether it will get “one more rate hike.”
Second thing: staking is locked up, big players are accumulating, retail is cutting losses
Staking rate is 35%. There’s a queue of 2.07 million ETH entering, waiting 36 days, and the exit queue is close to zero. Those who want to stake are still lining up; those who don’t want to exit at scale aren’t doing so.
ETF net assets are $15.2 billion, about 5.2% of ETH’s market cap. In August, inflows were $1.85 billion. BitMine continues adding; in August, big whales net increased by 430,000 ETH.
But staking yields are only 2.6%—lower than short-term U.S. Treasuries. It’s not really “driven by yield”; it looks more like long-term capital locking in inventory.
Third thing: the candlestick chart tells you—2,380 is the battlefield, not that the outcome is already decided
Weekly structure: the big bullish move in August broke through the descending trendline that began after the 2025 highs. The retest of the key level is the 0.618 Fibonacci level = 2,438. Now 2,380 is already slightly below that area, and this week’s close is extremely important.
Trading strategy
Scenario A: hold 2,350–2,380
Wait for a volume-backed stop of the selloff and a close with a lower wick. Then try a small long position. Stop-loss: 2,345–2,350. Targets: 2,420–2,450 → 2,480–2,520.
Scenario B: break below 2,350 and the rebound fails
On a rebound of 2,360–2,380, cut longs/refrain from new longs. Next buy zone: 2,280–2,220. If it gets worse: 2,050–2,000.
Scenario C: reclaim 2,438 and get a daily close solidly above it
Pull back 2,438–2,450 and go long for the medium term. Targets: 2,550 → 2,780 → 2,920. Until it holds, 2,550 is treated as resistance—not a breakout.