$ACE — this is the kind of move that makes a chart impossible to ignore
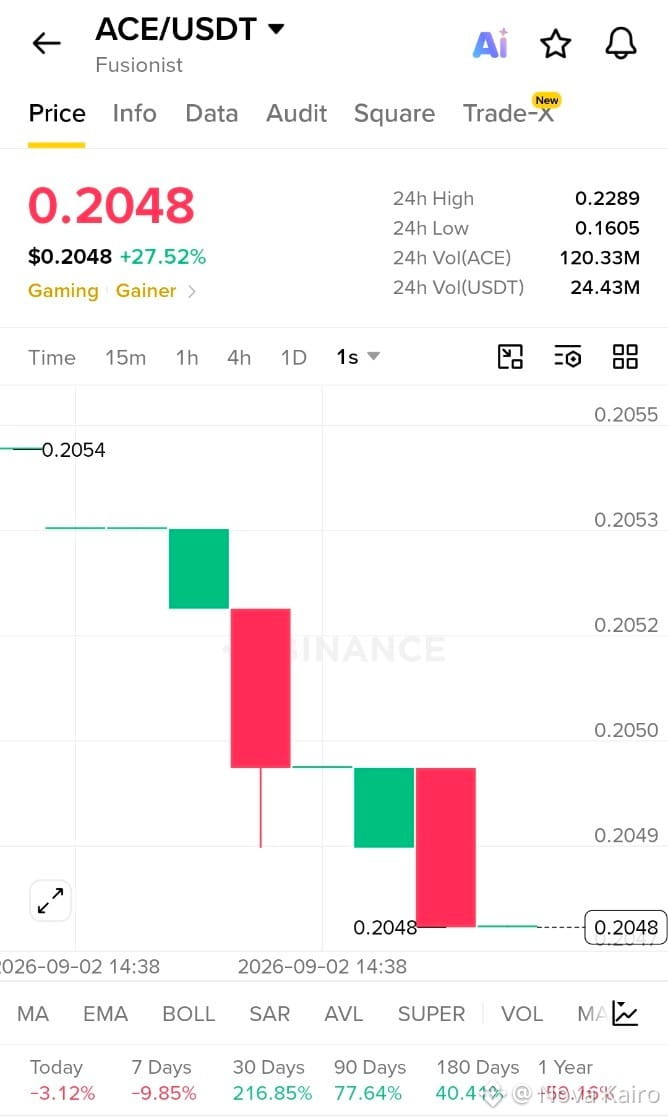
Fusionist is showing some serious short-term activity. In the chart shown, ACE is sitting around $0.2048, up 27.52% over 24H, with the price reaching a 24H high of $0.2289.
But the interesting part isn’t just the percentage.
The chart is showing 120.33M ACE in 24H volume, while USDT volume is around 24.43M. That’s a lot of activity around a token that has suddenly started moving much faster.
ACE also has a very interesting recent performance profile in the screenshot:
7D: -9.85%
30D: +216.85%
90D: +77.64%
180D: +40.41%
1Y: -59.16%
That tells a much more complicated story than simply saying “ACE is pumping.”
The 30-day move is massive, but the shorter 7-day number is still negative. So this isn’t a clean straight-line rally — there has been plenty of volatility along the way.
And today’s move from the $0.1605 24H low toward $0.2289 shows just how quickly sentiment around ACE can change.
Now I’m watching the reaction after that sharp move.
Does the volume remain strong?
Does price continue to hold the higher levels?
Or does the market cool down after the initial burst?
No predictions. No blind hype.
Just price action, volume and momentum.
Because after a move like this, the most interesting part may not be the candle that already happened — it’s what ACE does next....
The move has already made noise; now the chart has to prove whether the momentum has staying power.
$ACE #Ace #Crypto
Fusionist is showing some serious short-term activity. In the chart shown, ACE is sitting around $0.2048, up 27.52% over 24H, with the price reaching a 24H high of $0.2289.
But the interesting part isn’t just the percentage.
The chart is showing 120.33M ACE in 24H volume, while USDT volume is around 24.43M. That’s a lot of activity around a token that has suddenly started moving much faster.
ACE also has a very interesting recent performance profile in the screenshot:
7D: -9.85%
30D: +216.85%
90D: +77.64%
180D: +40.41%
1Y: -59.16%
That tells a much more complicated story than simply saying “ACE is pumping.”
The 30-day move is massive, but the shorter 7-day number is still negative. So this isn’t a clean straight-line rally — there has been plenty of volatility along the way.
And today’s move from the $0.1605 24H low toward $0.2289 shows just how quickly sentiment around ACE can change.
Now I’m watching the reaction after that sharp move.
Does the volume remain strong?
Does price continue to hold the higher levels?
Or does the market cool down after the initial burst?
No predictions. No blind hype.
Just price action, volume and momentum.
Because after a move like this, the most interesting part may not be the candle that already happened — it’s what ACE does next....
The move has already made noise; now the chart has to prove whether the momentum has staying power.
$ACE #Ace #Crypto