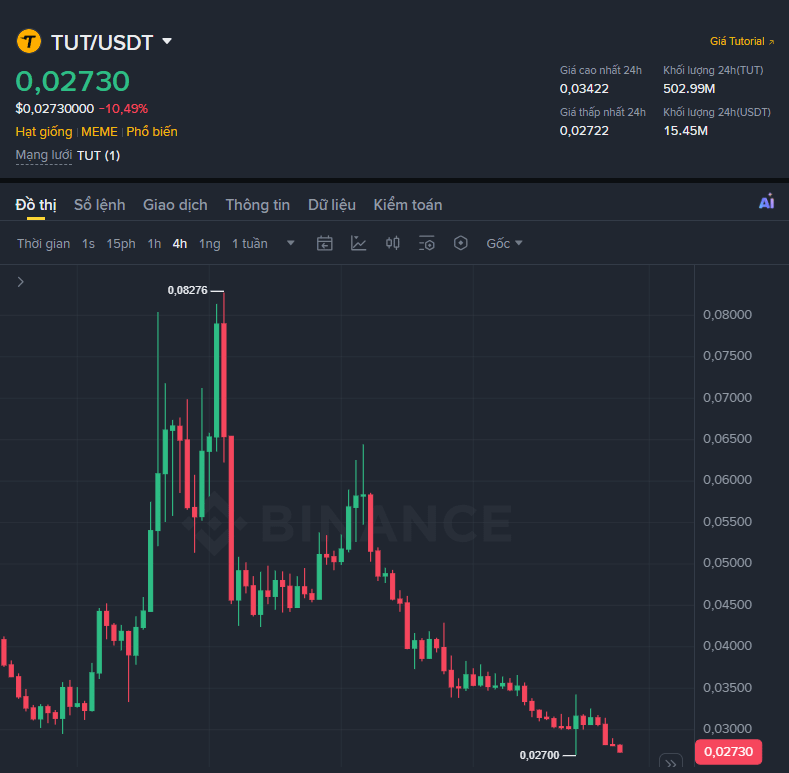

⚠️ $TUT đang cho mình một setup SHORT khá đáng chú ý.
Many people are looking at the 0.02736 area and waiting for a pullback, but I’m observing that the short-term structure is still leaning toward the bears.
$TUT / USDT — 🟢 SHORT · Confirmed 89%
🎯 The plan I’m tracking:
• Entry: 0.02727– 0.02744
• SL: 0.02960
• TP1: 0.02567
• TP2: 0.02455
• TP3: 0.02287
What catches my attention most is that the 15M RSI is around 25.39, meaning the market has fallen deep into an oversold zone. But being oversold doesn’t necessarily mean the price is guaranteed to reverse. If the bounce isn’t strong enough, this pullback zone could very well become a place where the sellers continue unloading.
On the 4H timeframe, the SHORT trend is still dominant with 89% reliability. Meanwhile, the 1D timeframe is still moving within a range, so I see this as a SHORT aligned with the momentum inside the range—rather than trying to top-tick a major uptrend.
📉 The 0.02736 level is the zone I’m especially watching.
If price can’t reclaim this area convincingly, the scenario I prioritize is continuing to slide to 0.02568, then toward 0.02456, and further to 0.02287.
The 1H ATR of about 0.000934 also suggests that $TUT still has enough volatility range for the lower targets to be tested if selling pressure continues to hold.
⚠️ However, I won’t FOMO, and I definitely won’t go all-in. SL 0.02960 is the invalidation point of the setup—if price hits that zone, I accept that I’m wrong and exit the trade.
What do you think: will the 15M oversold RSI create a strong enough bounce to reverse, or is 0.02736 just a pause point before TUT continues falling to 0.0256? 👀
Many people are looking at the 0.02736 area and waiting for a pullback, but I’m observing that the short-term structure is still leaning toward the bears.
$TUT / USDT — 🟢 SHORT · Confirmed 89%
🎯 The plan I’m tracking:
• Entry: 0.02727– 0.02744
• SL: 0.02960
• TP1: 0.02567
• TP2: 0.02455
• TP3: 0.02287
What catches my attention most is that the 15M RSI is around 25.39, meaning the market has fallen deep into an oversold zone. But being oversold doesn’t necessarily mean the price is guaranteed to reverse. If the bounce isn’t strong enough, this pullback zone could very well become a place where the sellers continue unloading.
On the 4H timeframe, the SHORT trend is still dominant with 89% reliability. Meanwhile, the 1D timeframe is still moving within a range, so I see this as a SHORT aligned with the momentum inside the range—rather than trying to top-tick a major uptrend.
📉 The 0.02736 level is the zone I’m especially watching.
If price can’t reclaim this area convincingly, the scenario I prioritize is continuing to slide to 0.02568, then toward 0.02456, and further to 0.02287.
The 1H ATR of about 0.000934 also suggests that $TUT still has enough volatility range for the lower targets to be tested if selling pressure continues to hold.
⚠️ However, I won’t FOMO, and I definitely won’t go all-in. SL 0.02960 is the invalidation point of the setup—if price hits that zone, I accept that I’m wrong and exit the trade.
What do you think: will the 15M oversold RSI create a strong enough bounce to reverse, or is 0.02736 just a pause point before TUT continues falling to 0.0256? 👀