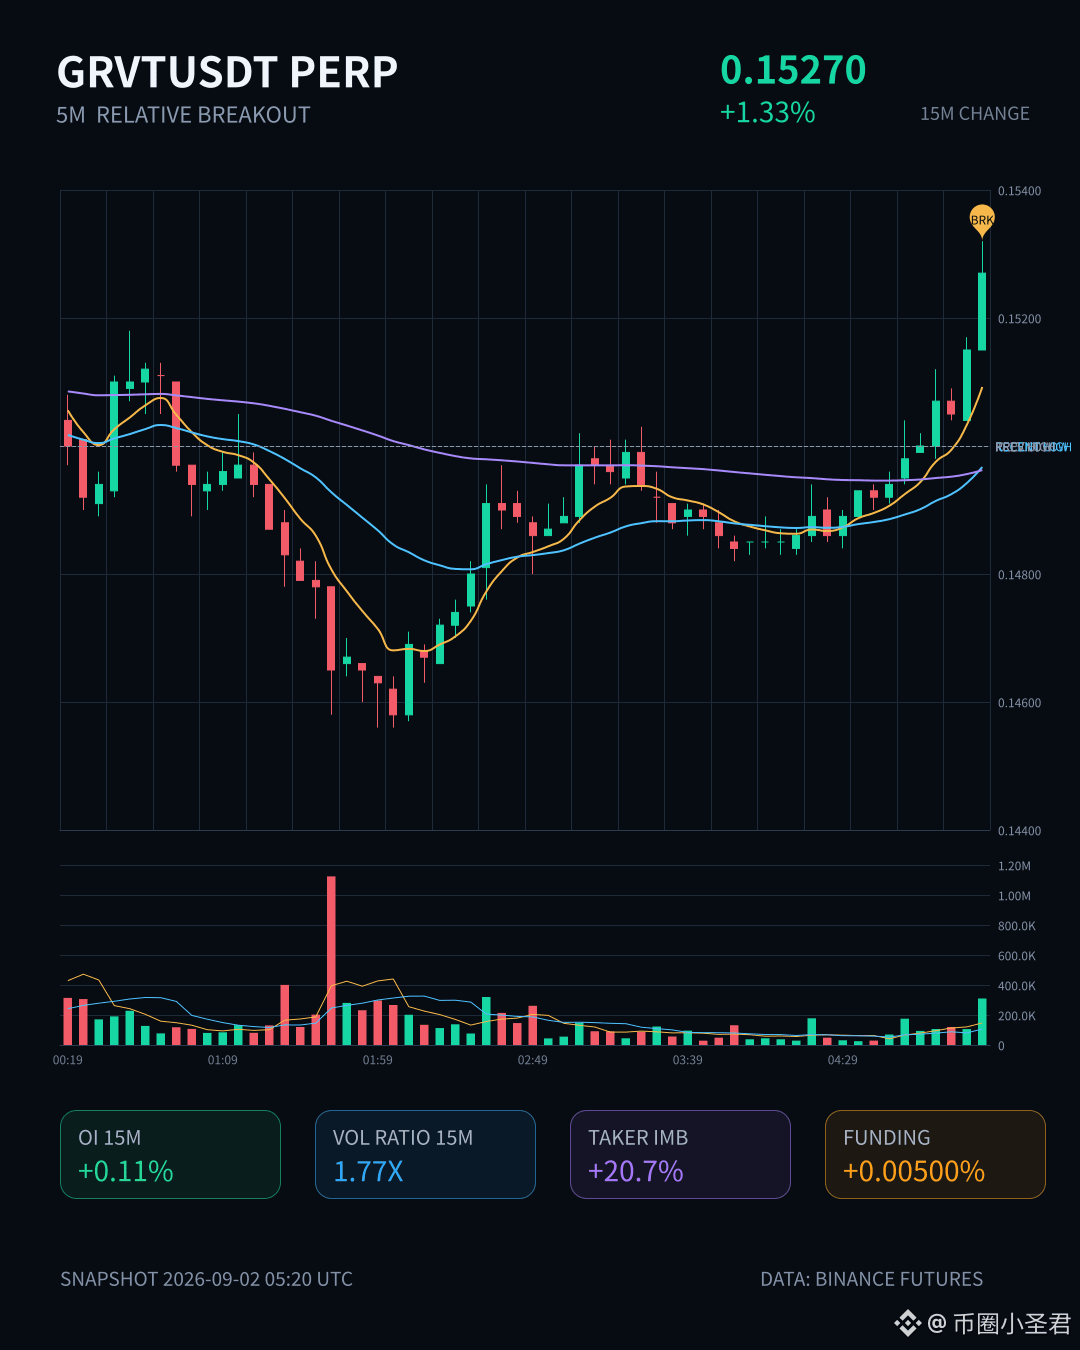
$GRVT This rally looks pretty interesting. On the 15-minute timeframe, it has directly broken through the upper boundary of the range of the past nearly 20 candles. Volume has expanded to 1.77x, and the aggressive buy side is clearly dominant: buy-to-sell ratio at 1.52—this is not order-book structure that retail traders could smash together.
OI data is even more worth pondering. The nominal change on the 15-minute level isn’t big, but on the 1-hour dimension the position has already added 3.26%, suggesting someone is absorbing long-term chips rather than simply triggering a short-term impulse. Current OI abnormal percentile has reached 94.4%, ranking 8th in the whole pool. From here, pushing higher would move into historical extreme territory.
During the session, the volatility Z-value is 2.11 and sentiment is already somewhat hot. But what really catches my attention isn’t the strength of a single candle—it’s that multiple consecutive periods have maintained this kind of pricing premium structure. Once inertia forms, the next part of the script may not be as simple as a straightforward pullback.
OI data is even more worth pondering. The nominal change on the 15-minute level isn’t big, but on the 1-hour dimension the position has already added 3.26%, suggesting someone is absorbing long-term chips rather than simply triggering a short-term impulse. Current OI abnormal percentile has reached 94.4%, ranking 8th in the whole pool. From here, pushing higher would move into historical extreme territory.
During the session, the volatility Z-value is 2.11 and sentiment is already somewhat hot. But what really catches my attention isn’t the strength of a single candle—it’s that multiple consecutive periods have maintained this kind of pricing premium structure. Once inertia forms, the next part of the script may not be as simple as a straightforward pullback.