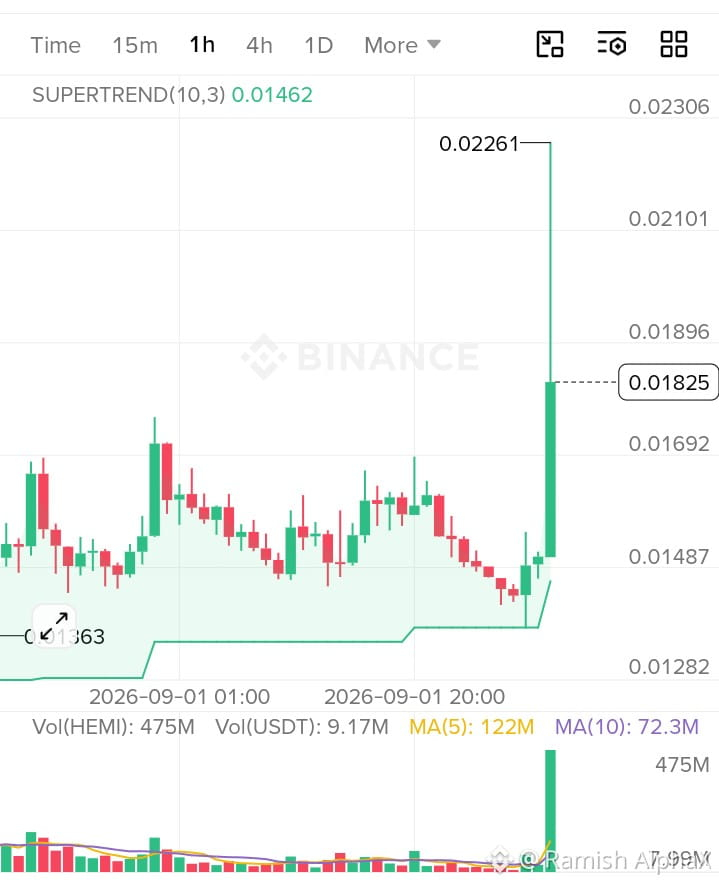
🔥 $HEMI / USDT: 1H Massive Parabolic Expansion & Volumetric Breakout to $0.02261
The 1-Hour (1H) chart for $HEMI /USDT reveals an extreme institutional volatility impulse. After coiling inside a tight consolidation base around $0.01363–$0.01487, price printed a massive expansion candle, sweeping overhead liquidations to a local peak of $0.02261 before stabilizing near $0.01825.
📊 Market Bias: Strongly Bullish (Vertical Impulse Phase)
Trend Analysis: On the 1H timeframe, HEMI has completed an aggressive structural trend flip. Price is trading well above its 1H Supertrend(10,3) dynamic trendline ($0.01462) and the prior range high ($0.01487). Although short-term wicking shows immediate profit-taking from the $0.02261 high, holding above $0.01690 indicates strong buyer re-absorption and high-timeframe continuation potential.
🎯 Trade Setup: LONG (On Demand Zone Retest)
Action: LONG on a shallow pullback into the 1H Fair Value Gap (FVG) / Order Block.
Entry Zone: $0.01620 – $0.01750 (Confluence with top of 1H structural consolidation breakout)
Stop Loss (SL): $0.01420 (Placed safely below the 1H Supertrend baseline at $0.01462)
Take Profit 1 (TP1): $0.02261 (Local Swing High / Buy-Side Liquidity Pool Sweep)
Take Profit 2 (TP2): $0.02650 (1.618 Fibonacci Extension Target)
Take Profit 3 (TP3): $0.03100 (Macro Expansion Projection)
Risk:Reward (R:R): ~1:3.1 (to TP2)
Trade Invalidation: A sustained 1H candle close below $0.01420 invalidates the bullish continuation bias.#HEMI #HEMIUSD #hemiusdt #BinanceHerYerde #BinancePizzaVN
The 1-Hour (1H) chart for $HEMI /USDT reveals an extreme institutional volatility impulse. After coiling inside a tight consolidation base around $0.01363–$0.01487, price printed a massive expansion candle, sweeping overhead liquidations to a local peak of $0.02261 before stabilizing near $0.01825.
📊 Market Bias: Strongly Bullish (Vertical Impulse Phase)
Trend Analysis: On the 1H timeframe, HEMI has completed an aggressive structural trend flip. Price is trading well above its 1H Supertrend(10,3) dynamic trendline ($0.01462) and the prior range high ($0.01487). Although short-term wicking shows immediate profit-taking from the $0.02261 high, holding above $0.01690 indicates strong buyer re-absorption and high-timeframe continuation potential.
🎯 Trade Setup: LONG (On Demand Zone Retest)
Action: LONG on a shallow pullback into the 1H Fair Value Gap (FVG) / Order Block.
Entry Zone: $0.01620 – $0.01750 (Confluence with top of 1H structural consolidation breakout)
Stop Loss (SL): $0.01420 (Placed safely below the 1H Supertrend baseline at $0.01462)
Take Profit 1 (TP1): $0.02261 (Local Swing High / Buy-Side Liquidity Pool Sweep)
Take Profit 2 (TP2): $0.02650 (1.618 Fibonacci Extension Target)
Take Profit 3 (TP3): $0.03100 (Macro Expansion Projection)
Risk:Reward (R:R): ~1:3.1 (to TP2)
Trade Invalidation: A sustained 1H candle close below $0.01420 invalidates the bullish continuation bias.#HEMI #HEMIUSD #hemiusdt #BinanceHerYerde #BinancePizzaVN