🔥 Can UAI still go up? After reviewing the 15-minute, 1-hour, and 4-hour charts—all of it—I’m very clear on my view: the trend hasn’t turned bad. Continue looking for longs, but under no circumstances get carried away and chase the breakout here!
First, the conclusion:
UAIUSDT perpetuals—the main idea is still to go long.
Why?
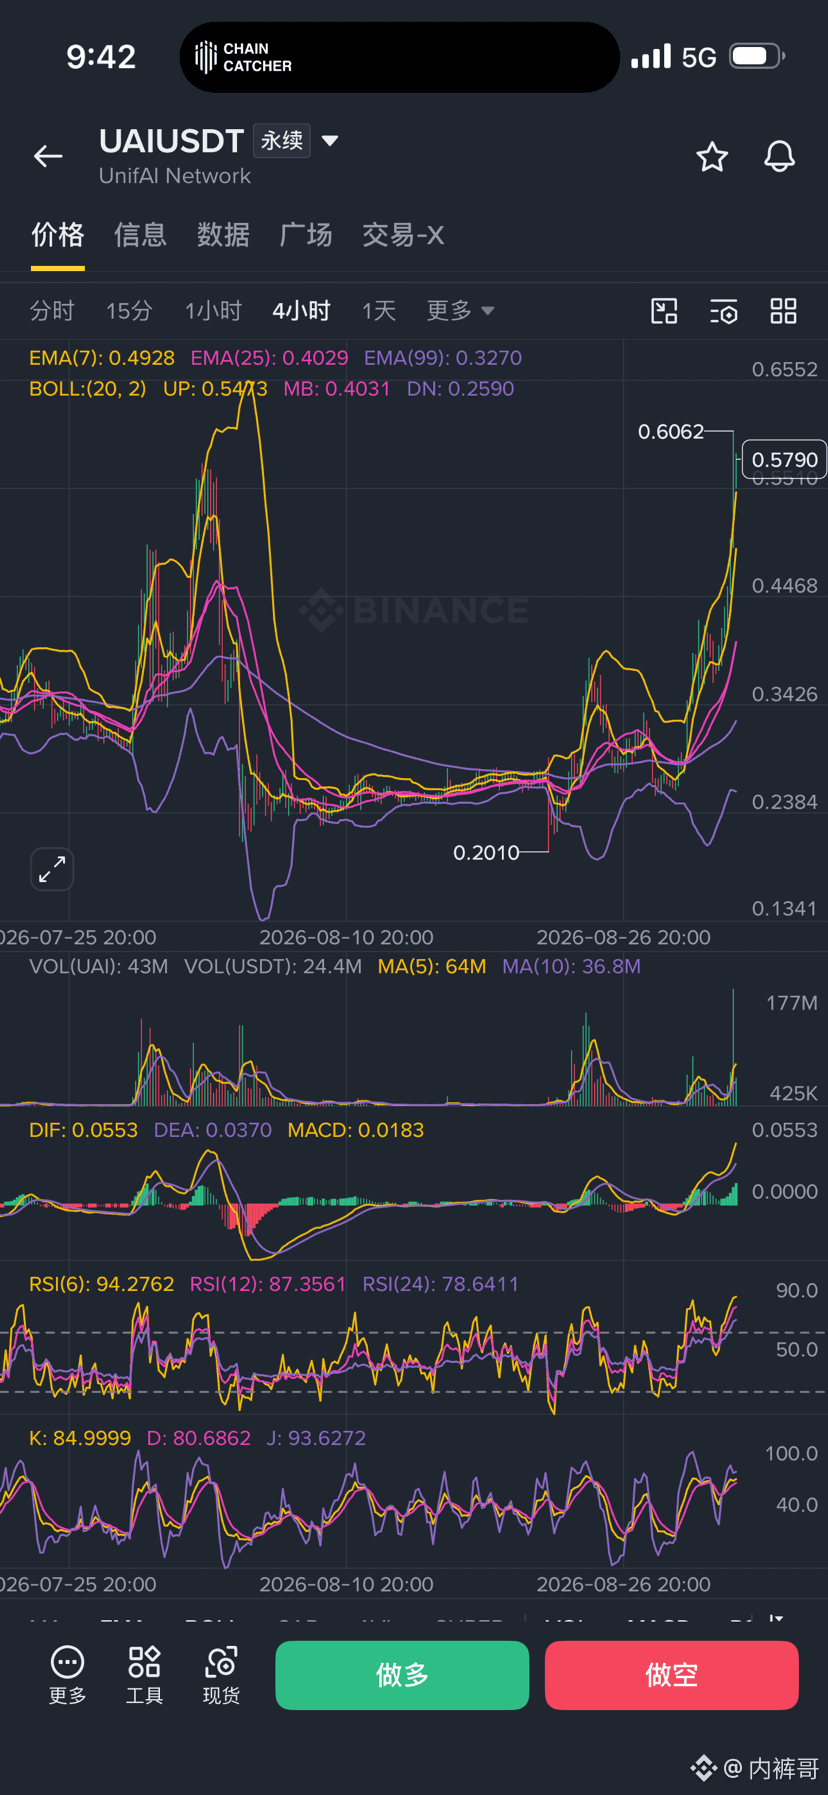
The 4-hour timeframe is the most critical.
This leg rallied from around 0.20 all the way up—the structure is very clean. Price is already trading above the EMA7, EMA25, and EMA99, and the moving averages show a clear bullish alignment.
The Bollinger Bands are also opening upward. MACD continues to run above the 0 axis, and volume is keeping up.
This isn’t the kind of pull-up where they just jab one spike—it’s trend strength plus volume working together.
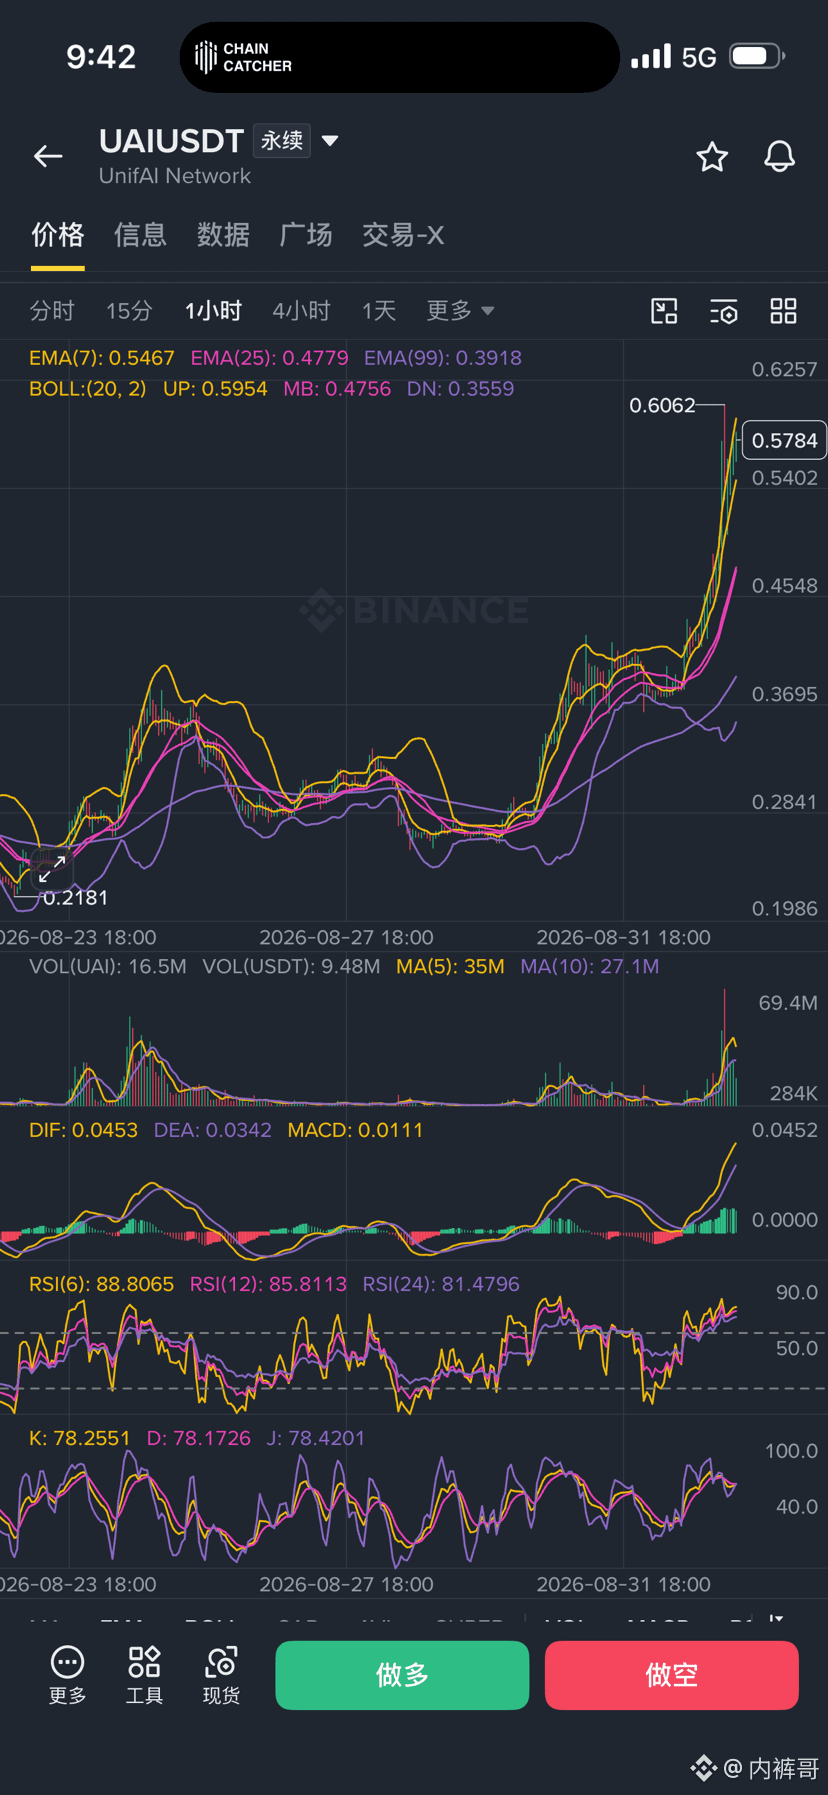
Now look at the 1-hour chart—it's even more obvious.
Since August 31, price has mostly been rising along the EMA7 line. On the few pullbacks, price managed to find support around the EMA25.
At the moment, around 0.578. Above that, around 0.595 is the Bollinger upper band—also the first resistance level for the short term.
If later it can break 0.595 with increased volume and hold, then 0.605–0.610 is likely to be tested again.
Higher up, around 0.65 is the next target zone.
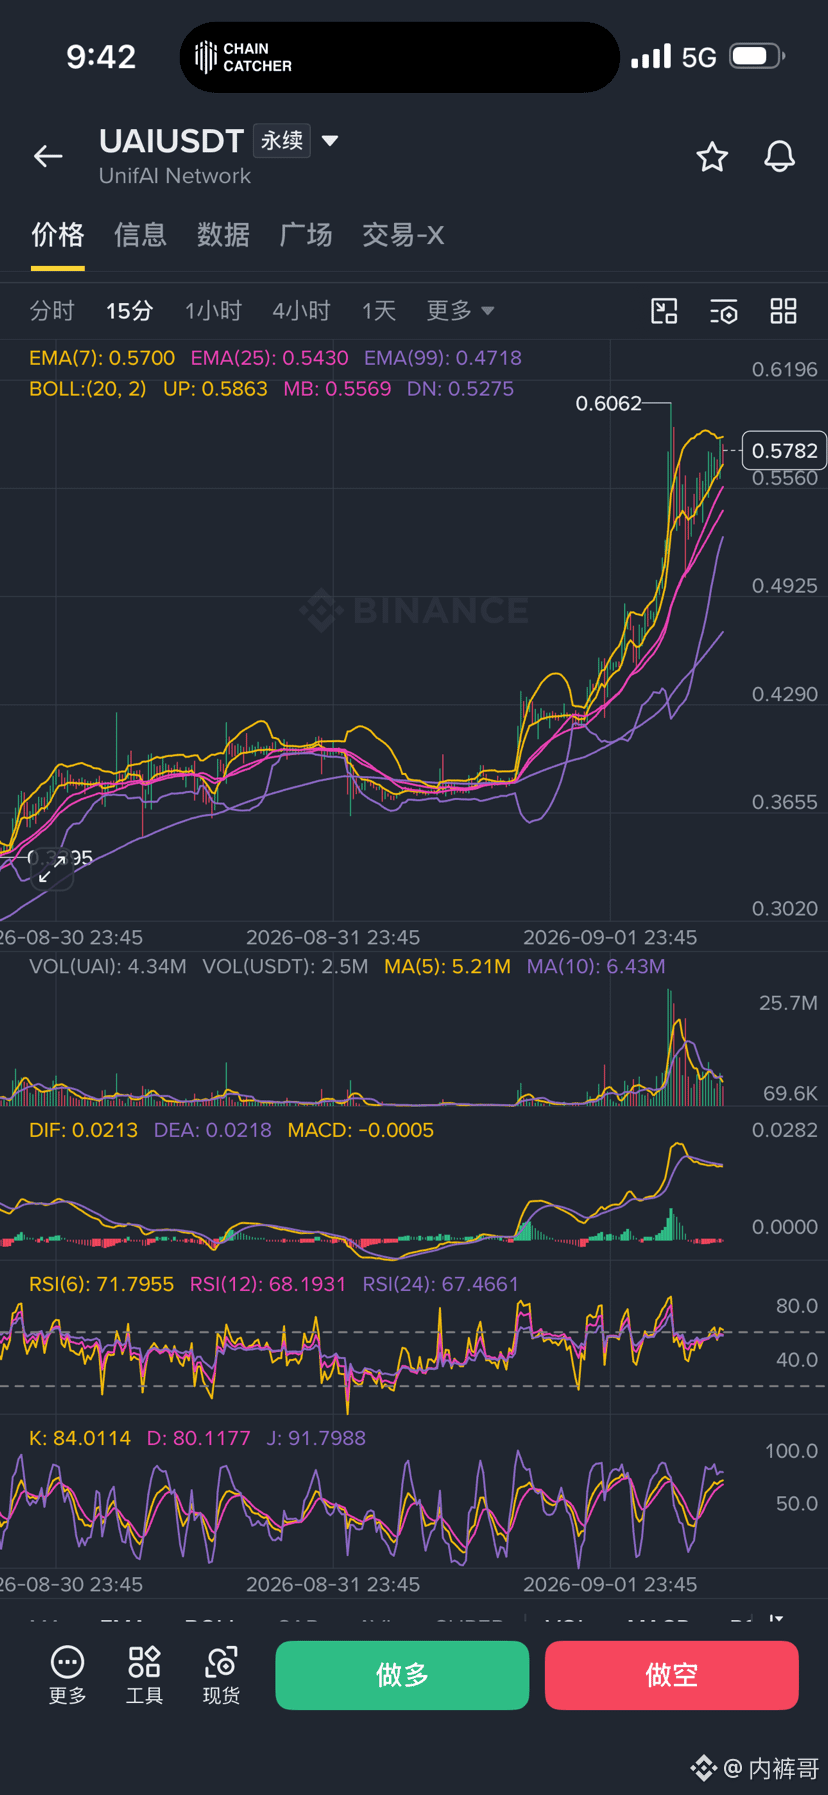
However, for the 15-minute chart, I actually don’t recommend chasing.
The short-term move has been a bit too fast—EMA7 is already sticking to price, MACD shows slight signs of a potential dead cross, and RSI and KDJ are also all in overbought territory.
In short:
The bigger trend is strong, but the smaller timeframe is starting to catch its breath.
So the most comfortable trade right now isn’t jumping in just because you see green candles—it’s to wait for a pullback.
📌 My trading plan:
Long positions to watch: 0.565–0.575
First target: 0.605–0.610
Second target: around 0.65
Defensive level: 0.548
If the 1-hour chart breaks below 0.55 decisively, and the rebound can’t get back above it, then don’t try to fight the trend—step back first, then wait for the structure to reset.
One more thing I must remind you:
UAI is a strong AI-narrative coin—when it runs, it can be extremely aggressive. But perpetuals can also easily show needle spikes, long liquidations, and fast pullbacks.
So I’m more inclined to:
Buy the dip on pullbacks > Chase a breakout > Go all-in at high levels.
If you already have a position, you can continue to monitor the trend.
If you’re not in yet, there’s no need to panic and fear missing out.
The truly good opportunities often aren’t when candles are疯狂ly blasting upward—rather, when others start to panic and sell, and you can clearly see where support is.
Right now, above 0.55, the bullish structure is still intact.
#uai $UAI
First, the conclusion:
UAIUSDT perpetuals—the main idea is still to go long.
Why?
The 4-hour timeframe is the most critical.
This leg rallied from around 0.20 all the way up—the structure is very clean. Price is already trading above the EMA7, EMA25, and EMA99, and the moving averages show a clear bullish alignment.
The Bollinger Bands are also opening upward. MACD continues to run above the 0 axis, and volume is keeping up.
This isn’t the kind of pull-up where they just jab one spike—it’s trend strength plus volume working together.
Now look at the 1-hour chart—it's even more obvious.
Since August 31, price has mostly been rising along the EMA7 line. On the few pullbacks, price managed to find support around the EMA25.
At the moment, around 0.578. Above that, around 0.595 is the Bollinger upper band—also the first resistance level for the short term.
If later it can break 0.595 with increased volume and hold, then 0.605–0.610 is likely to be tested again.
Higher up, around 0.65 is the next target zone.
However, for the 15-minute chart, I actually don’t recommend chasing.
The short-term move has been a bit too fast—EMA7 is already sticking to price, MACD shows slight signs of a potential dead cross, and RSI and KDJ are also all in overbought territory.
In short:
The bigger trend is strong, but the smaller timeframe is starting to catch its breath.
So the most comfortable trade right now isn’t jumping in just because you see green candles—it’s to wait for a pullback.
📌 My trading plan:
Long positions to watch: 0.565–0.575
First target: 0.605–0.610
Second target: around 0.65
Defensive level: 0.548
If the 1-hour chart breaks below 0.55 decisively, and the rebound can’t get back above it, then don’t try to fight the trend—step back first, then wait for the structure to reset.
One more thing I must remind you:
UAI is a strong AI-narrative coin—when it runs, it can be extremely aggressive. But perpetuals can also easily show needle spikes, long liquidations, and fast pullbacks.
So I’m more inclined to:
Buy the dip on pullbacks > Chase a breakout > Go all-in at high levels.
If you already have a position, you can continue to monitor the trend.
If you’re not in yet, there’s no need to panic and fear missing out.
The truly good opportunities often aren’t when candles are疯狂ly blasting upward—rather, when others start to panic and sell, and you can clearly see where support is.
Right now, above 0.55, the bullish structure is still intact.
#uai $UAI