Is $MIRA Bouncing Off Support For Another Potential Wave Up…!!
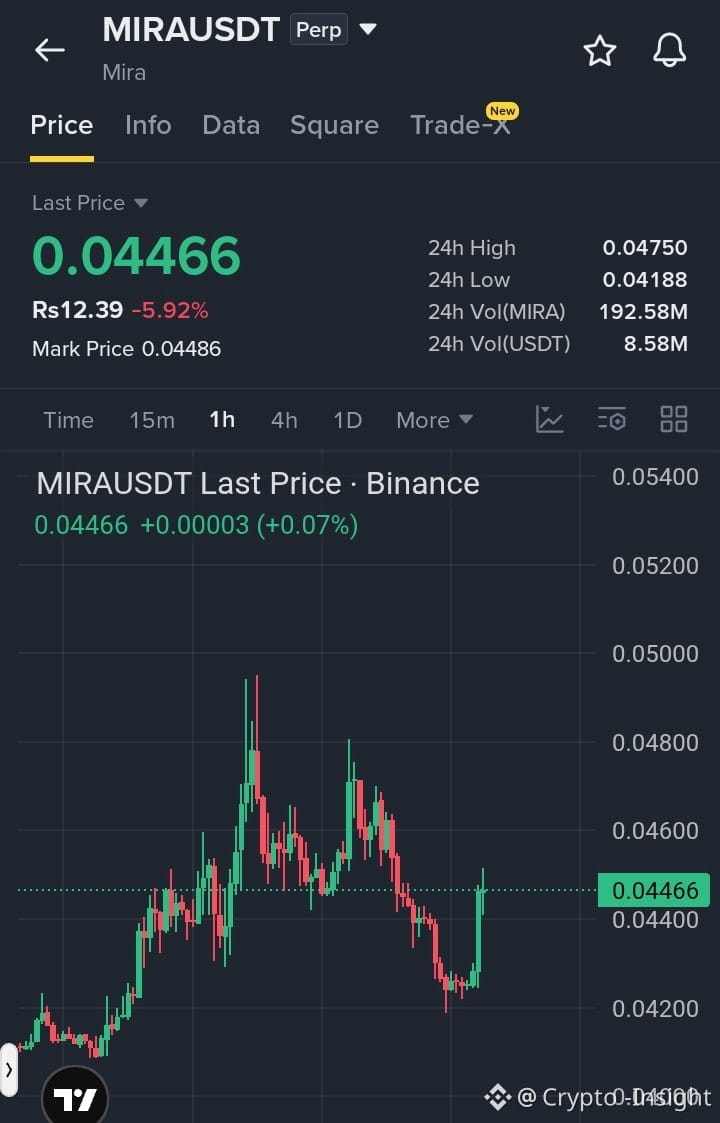
#MIRA is showing signs of a strong recovery on the 1h timeframe as price trades around 0.04466 after holding firm above its key support base near the 24h low of 0.04188 The chart structure indicates buyers stepping in aggressively to defend lower levels after a local pullback as price moves to retest immediate resistance near the 24h high of 0.04750 If bullish momentum sustains and breaks above this resistance level the next potential targets to watch are 0.05000 and 0.05200 while 0.04188 remains the key support level keeping this recovery structure valid
$ACE
$BTW
#MIRA is showing signs of a strong recovery on the 1h timeframe as price trades around 0.04466 after holding firm above its key support base near the 24h low of 0.04188 The chart structure indicates buyers stepping in aggressively to defend lower levels after a local pullback as price moves to retest immediate resistance near the 24h high of 0.04750 If bullish momentum sustains and breaks above this resistance level the next potential targets to watch are 0.05000 and 0.05200 while 0.04188 remains the key support level keeping this recovery structure valid
$ACE
$BTW