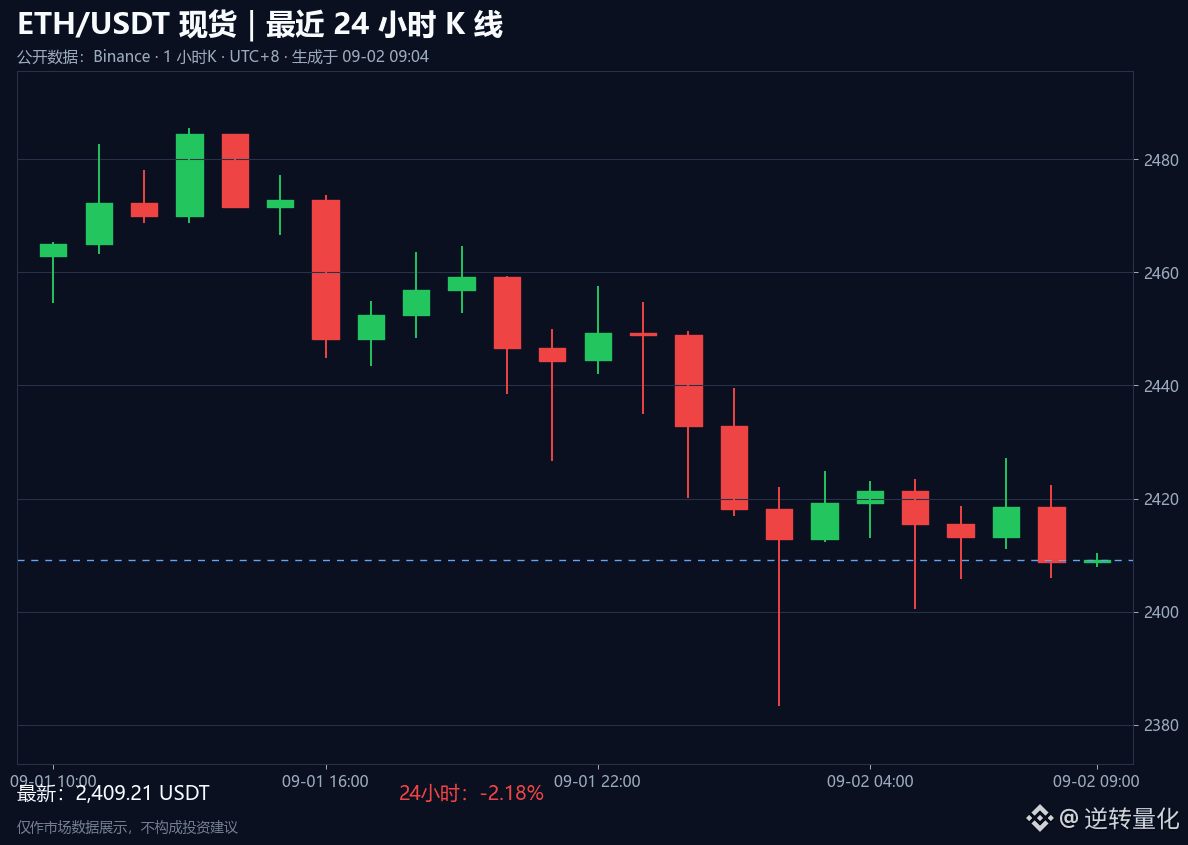
September 2 early trading, the 24-hour candlestick chart of $ETH has fallen back to around $2,409. For the short term, the key is not the color of a single candlestick, but whether after the pullback the price can be brought back to the position that was just lost.
The latest executed trade samples mainly fall in the $2,403–$2,409 range, and the funding rate remains slightly positive. With the price hovering near a dense trading range and the funding rate still偏正, it suggests that the prior bullish expectations are still undergoing a price test; if the price can stay above this band, the decline is more likely a rhythm adjustment. If it continues to fall below it, the market will need more time to rebuild and restore support.
The chart reflects the current market condition and does not constitute any trading advice. $ETH #以太坊 #cryptocurrency market
The latest executed trade samples mainly fall in the $2,403–$2,409 range, and the funding rate remains slightly positive. With the price hovering near a dense trading range and the funding rate still偏正, it suggests that the prior bullish expectations are still undergoing a price test; if the price can stay above this band, the decline is more likely a rhythm adjustment. If it continues to fall below it, the market will need more time to rebuild and restore support.
The chart reflects the current market condition and does not constitute any trading advice. $ETH #以太坊 #cryptocurrency market