

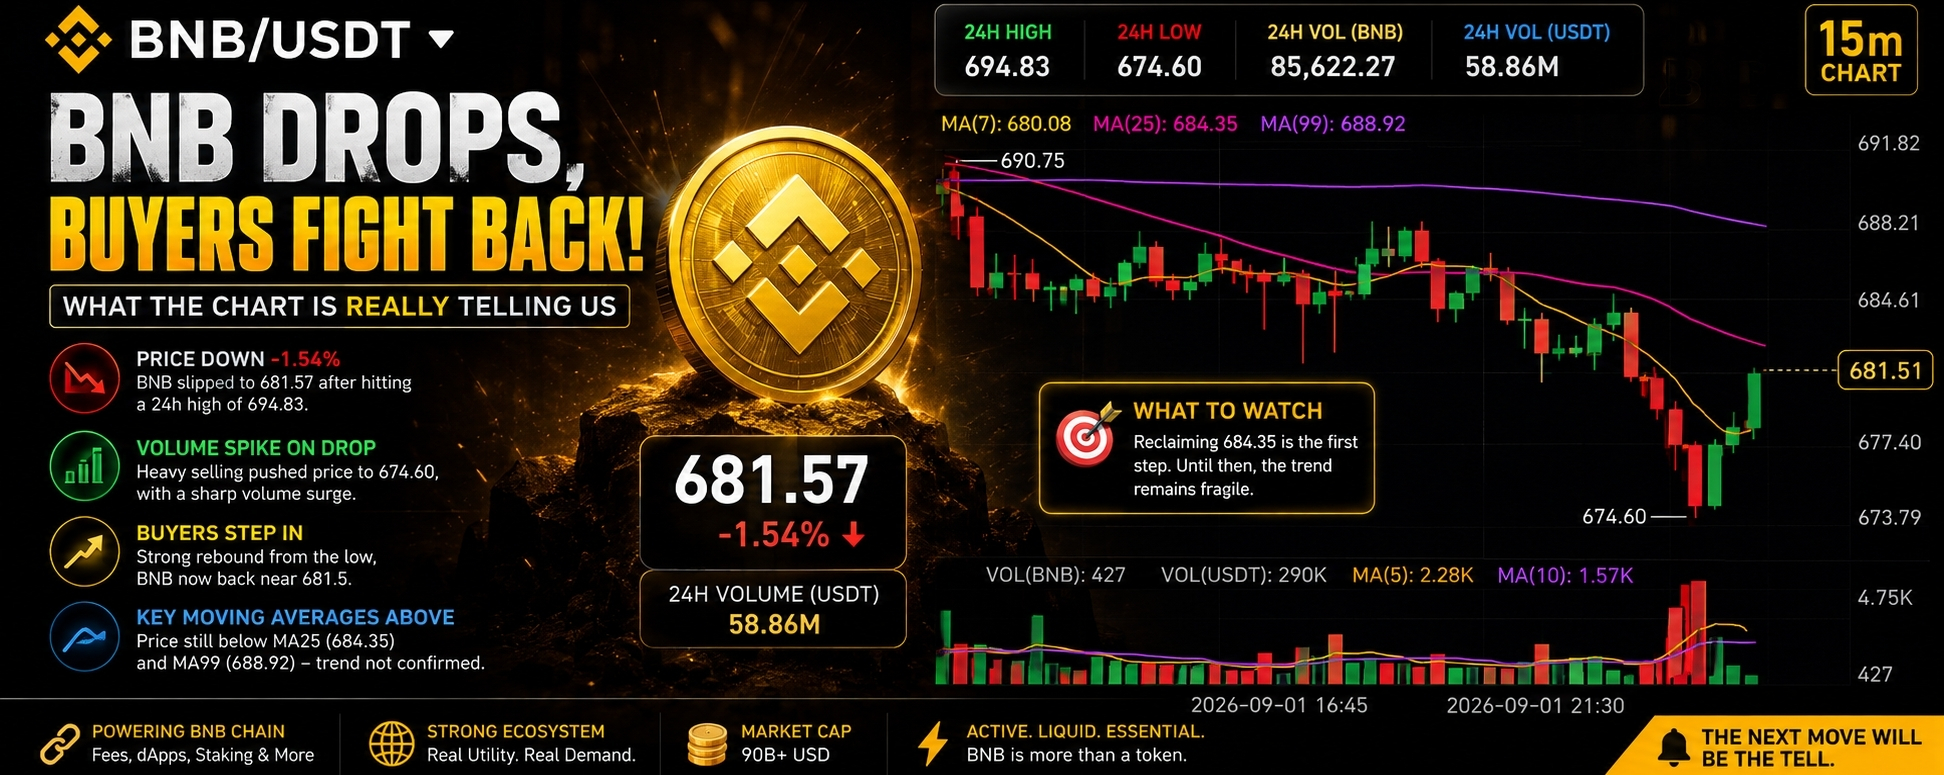

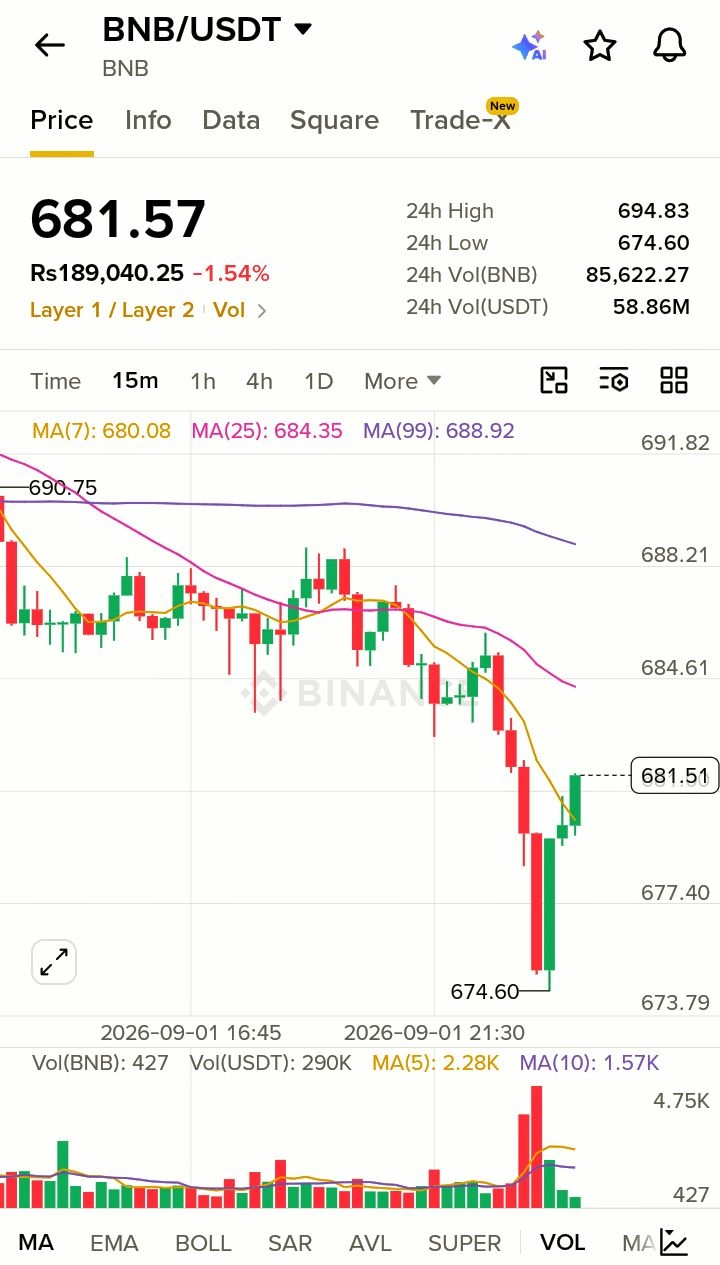
$BNB /USDT slipped to 681.57, down 1.54%, after falling from the 694.83 daily high to 674.60. On the 15-minute chart, the sharp red move came with a clear volume surge—then buyers appeared near 674.60 and pushed price back toward 681.5. The quiet detail is the rebound: it is happening below the 25-MA (684.35) and 99-MA (688.92), so the recovery has not yet erased the weakness. BNB remains deeply tied to BNB Chain’s ecosystem, where it serves as the native asset for fees and other network activity.
What stands out to me is not the red candle itself. It is the sequence: heavy selling, a low-volume pause, then a fast bounce. That usually tells a more interesting story than a headline percentage.
The screenshot also shows 24h volume of 58.86M USDT. Current market data shows BNB still trading around the high-$600s, with a market capitalization above $90 billion.
And there is another layer many chart watchers miss: BNB is not simply an exchange ticker. It sits underneath an ecosystem used for transaction fees, staking and applications across BNB Chain.
For now, the chart looks less like a clean reversal and more like a market catching its breath after a violent flush.
Sometimes the most revealing candle is the one that comes after the panic.