$BTC Crypto Circle Academician: Bitcoin (BTC) high-level consolidation with underlying currents—has a Bitcoin turning point signal already appeared? Latest market trend analysis and trading suggestions
Bitcoin current price 78,000—still feeling confused? Looking at the chart staying neither up nor down, you’re worried about missing out on the next rally, yet also afraid that chasing high will trap you at the top. After a big surge, market disagreement becomes much stronger; many people are stuck deciding whether to keep long or instead open short positions. My staying on the train is still my choice—of course, the market won’t keep rising in one direction forever. After a blowout surge, there will inevitably be a pullback and buildup of energy. Blindly chasing or selling is the easiest way to get hit back and forth, so I’m not getting off for now.
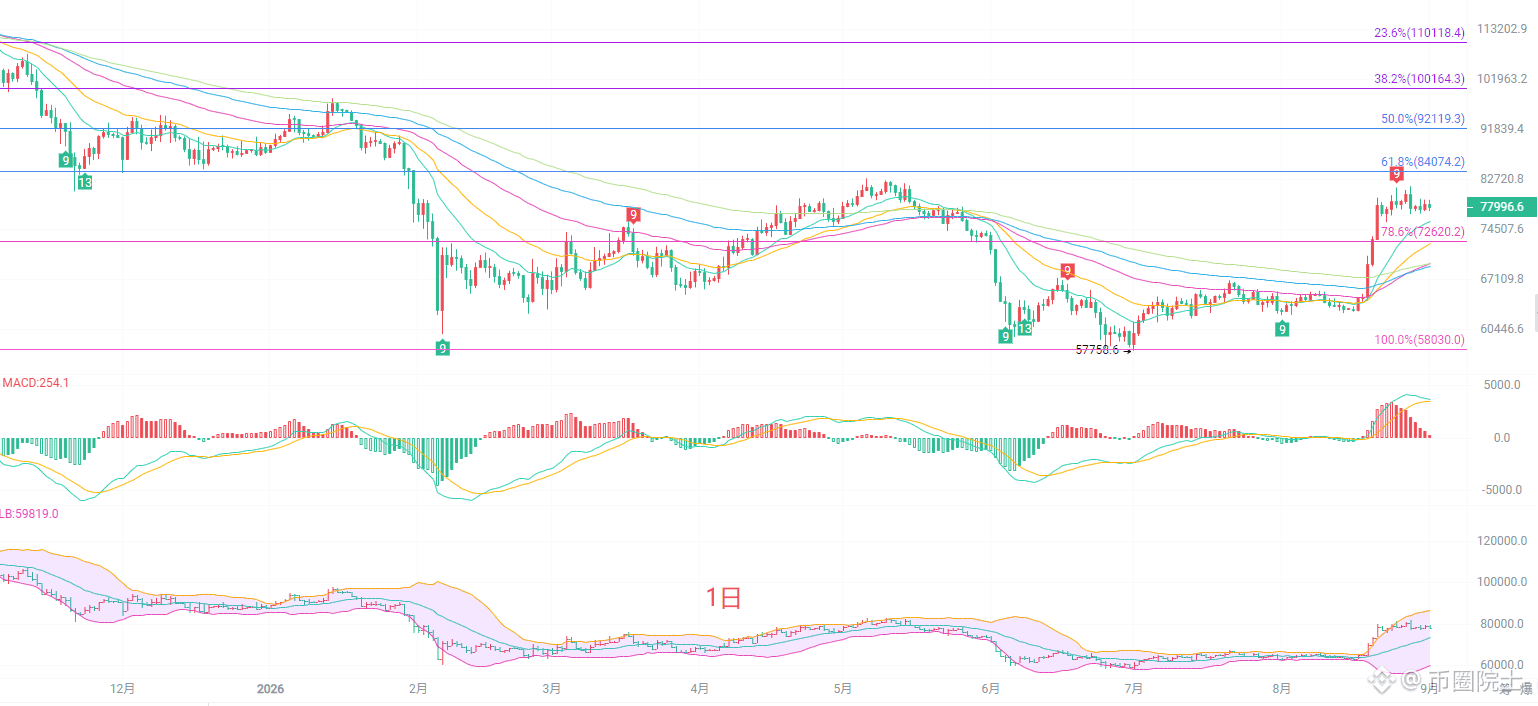
On the daily (K) line, price is still above multiple EMA moving averages. The broader medium-term bull structure hasn’t been directly broken. The 15-period EMA at 75,752 forms short-term strong support, while the 30-period EMA at 72,280 is an important medium-term defense level. The MACD histogram red bars are gradually shortening, suggesting bullish momentum is weakening. The Bollinger upper band at 86,316 is capping upside room; the middle band continues to run upward. The 78.6% Fibonacci level at 72,620 is a key watershed. As long as this level isn’t broken down effectively, the daily timeframe still falls under a pullback correction after a rise. If selling pressure persists, price may test moving-average support further down. In terms of execution, it’s not advisable to blindly chase; waiting for the pullback confirmation is safer.
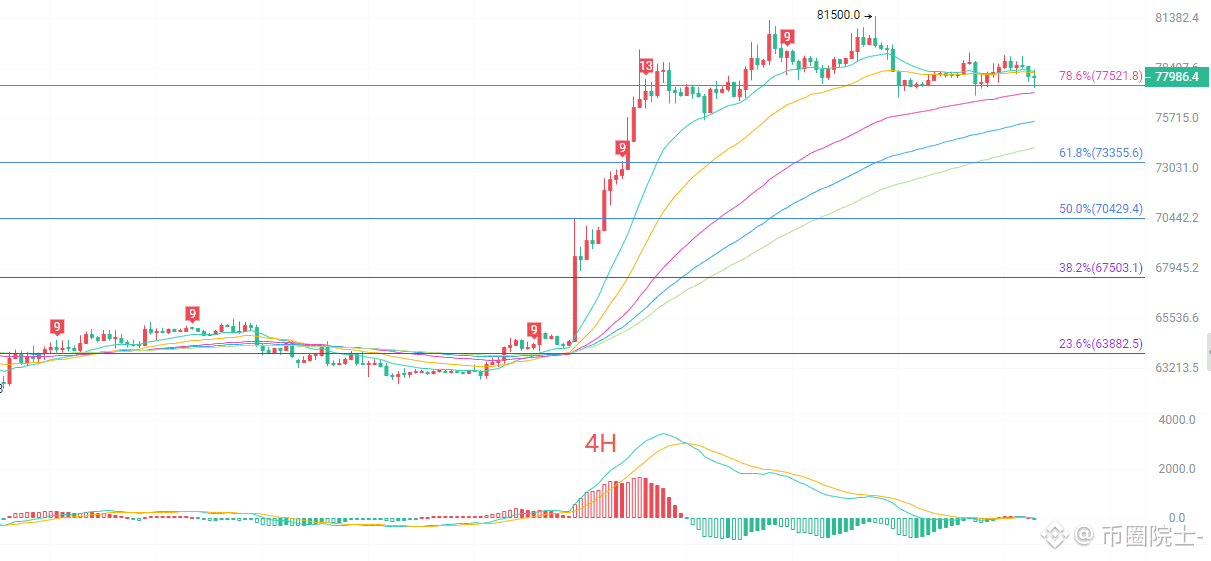
On the four-hour (K) line, price is tugging back and forth around the middle Bollinger band. The short-term EMA15 and EMA30 are flattening, and upside momentum has clearly slowed, entering a high-range range-trading pattern. The 78.6% Fibonacci area at 77,521–78,200 forms immediate resistance, while the 61.8% Fibonacci level at 73,355 is an important support below. In the four-hour MACD, the DIF and DEA are sticking and winding together, indicating that bullish and bearish forces are fairly balanced, with no clear one-sided signal. The Bollinger bands are starting to converge, suggesting that a directional breakout may be near in the short term, and the consolidation range keeps narrowing. Currently there’s no obvious trend; try to avoid placing chase orders. Wait until the price breaks out of the range, then follow the trend to reduce whipsaw stop-outs during the choppy market.
Short-term reference:
Buy-side support: 77,500 to 77,000. Stop loss: 500 points. Targets: 80,200 to 81,200.
Sell-side pressure: 81,200 to 81,600. Stop loss: 500 points. Targets: 80,000 to 79,000.
Specific execution should be based primarily on real-time order book data. For more information, please consult the author.
#BTC走势分析
Bitcoin current price 78,000—still feeling confused? Looking at the chart staying neither up nor down, you’re worried about missing out on the next rally, yet also afraid that chasing high will trap you at the top. After a big surge, market disagreement becomes much stronger; many people are stuck deciding whether to keep long or instead open short positions. My staying on the train is still my choice—of course, the market won’t keep rising in one direction forever. After a blowout surge, there will inevitably be a pullback and buildup of energy. Blindly chasing or selling is the easiest way to get hit back and forth, so I’m not getting off for now.
On the daily (K) line, price is still above multiple EMA moving averages. The broader medium-term bull structure hasn’t been directly broken. The 15-period EMA at 75,752 forms short-term strong support, while the 30-period EMA at 72,280 is an important medium-term defense level. The MACD histogram red bars are gradually shortening, suggesting bullish momentum is weakening. The Bollinger upper band at 86,316 is capping upside room; the middle band continues to run upward. The 78.6% Fibonacci level at 72,620 is a key watershed. As long as this level isn’t broken down effectively, the daily timeframe still falls under a pullback correction after a rise. If selling pressure persists, price may test moving-average support further down. In terms of execution, it’s not advisable to blindly chase; waiting for the pullback confirmation is safer.
On the four-hour (K) line, price is tugging back and forth around the middle Bollinger band. The short-term EMA15 and EMA30 are flattening, and upside momentum has clearly slowed, entering a high-range range-trading pattern. The 78.6% Fibonacci area at 77,521–78,200 forms immediate resistance, while the 61.8% Fibonacci level at 73,355 is an important support below. In the four-hour MACD, the DIF and DEA are sticking and winding together, indicating that bullish and bearish forces are fairly balanced, with no clear one-sided signal. The Bollinger bands are starting to converge, suggesting that a directional breakout may be near in the short term, and the consolidation range keeps narrowing. Currently there’s no obvious trend; try to avoid placing chase orders. Wait until the price breaks out of the range, then follow the trend to reduce whipsaw stop-outs during the choppy market.
Short-term reference:
Buy-side support: 77,500 to 77,000. Stop loss: 500 points. Targets: 80,200 to 81,200.
Sell-side pressure: 81,200 to 81,600. Stop loss: 500 points. Targets: 80,000 to 79,000.
Specific execution should be based primarily on real-time order book data. For more information, please consult the author.
#BTC走势分析