$FF broke out of a long base, but the liquidation map carries a thick reminder below.
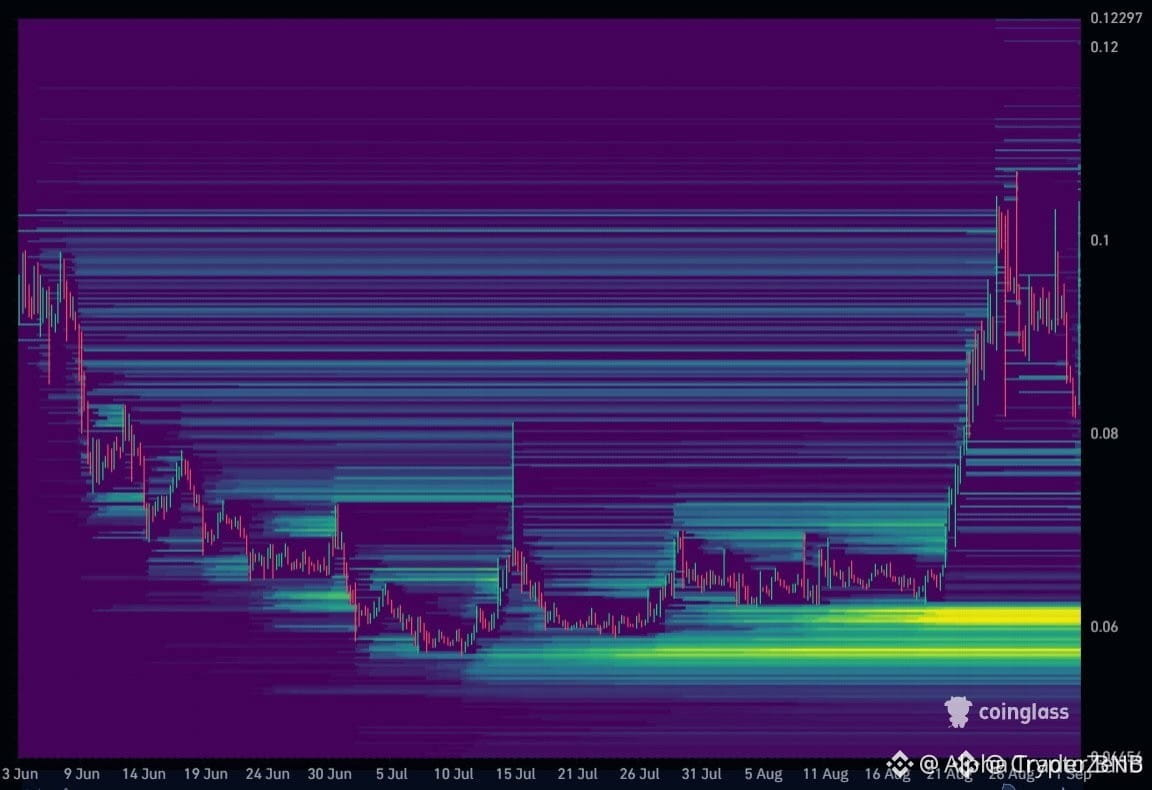
The chart tells a clear story. From June through mid-August, price consolidated in the 0.06-0.08 range, with a very thick buildup around 0.06 (the bright yellow/green line). Around August 21-26, it broke sharply out of that range toward 0.10-0.12, and it's trading at 0.10056 now.
L/S at 0.46, the crowd is clearly short. Top trader positions at 3.05, big accounts are more than six times more long than the crowd. OI at 12.6% of mcap, futures at 4.5x spot, the structure sits in the healthy range. Funding is flat, taker leans slightly buyer.
The split and structure favor the upside. But that thick cluster at 0.06, roughly 40% below current price, is worth keeping in mind as a reference point if a pullback happens, there's a large buildup sitting there.$FF #HangSengFalls1%
The chart tells a clear story. From June through mid-August, price consolidated in the 0.06-0.08 range, with a very thick buildup around 0.06 (the bright yellow/green line). Around August 21-26, it broke sharply out of that range toward 0.10-0.12, and it's trading at 0.10056 now.
L/S at 0.46, the crowd is clearly short. Top trader positions at 3.05, big accounts are more than six times more long than the crowd. OI at 12.6% of mcap, futures at 4.5x spot, the structure sits in the healthy range. Funding is flat, taker leans slightly buyer.
The split and structure favor the upside. But that thick cluster at 0.06, roughly 40% below current price, is worth keeping in mind as a reference point if a pullback happens, there's a large buildup sitting there.$FF #HangSengFalls1%