$ETH Coin Circle Academician: Profits on Ethereum (ETH) at 9.2 are being concentrated and digested; a deep dive into the underlying logic of Ethereum’s volatile trading range? Latest market analysis reference
Ethereum’s current price is 2449. Unsure of direction? If it rises a bit, you fear a spike followed by a pullback; if it drops a bit, you worry the big move hasn’t finished yet. Chasing back and forth to cut losses is extremely torturous. This leg of the rally from the lows has been sizable. Bulls have built up a large amount of profit-taking. The chart is no longer one-way mindless上涨; the game between bulls and bears is intensifying. Many people are stuck debating whether to keep going long in the same direction or to set up short positions on rallies—because you missed the chance to go north with me from the low, and that’s why you’re left feeling uncertain and uneasy.
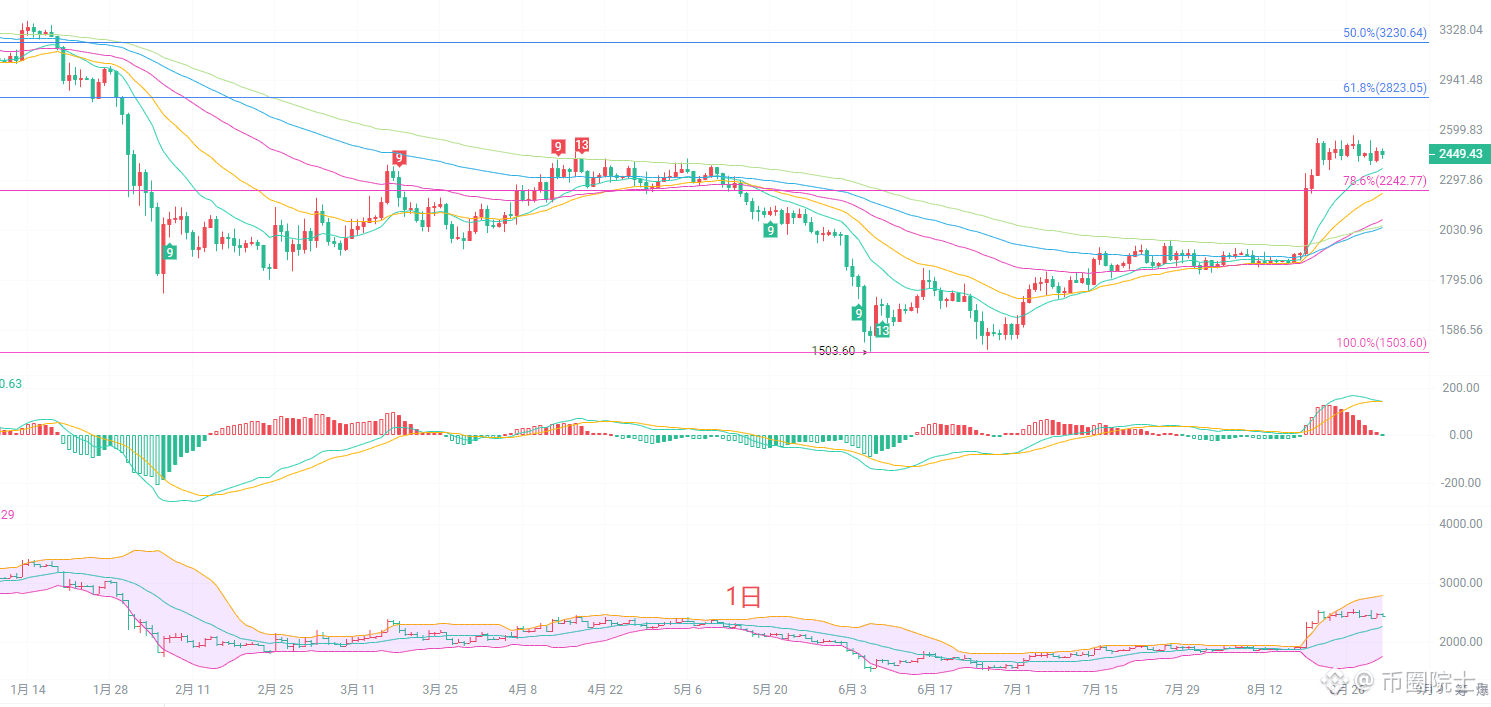
The daily (日K) candle pullback has entered a high-level consolidation range. The moving average system remains in a bullish alignment, with the short-term EMA15 and EMA30 lines forming support below, indicating that the larger-scale uptrend hasn’t been directly broken. The Bollinger Bands are opening upward, and price is oscillating near the upper band. The MACD histogram red bars are gradually shrinking; DIF and DEA remain above the zero line, but bullish momentum is weakening. The main resistance above is concentrated at 2566, the prior high. This is a key checkpoint for this rally; if it cannot break through effectively, it will continue to face pressure and pull back. Key support below is around 2242, the 78.6% Fibonacci level. Once this level breaks, the space for daily-level pullbacks will open up further.
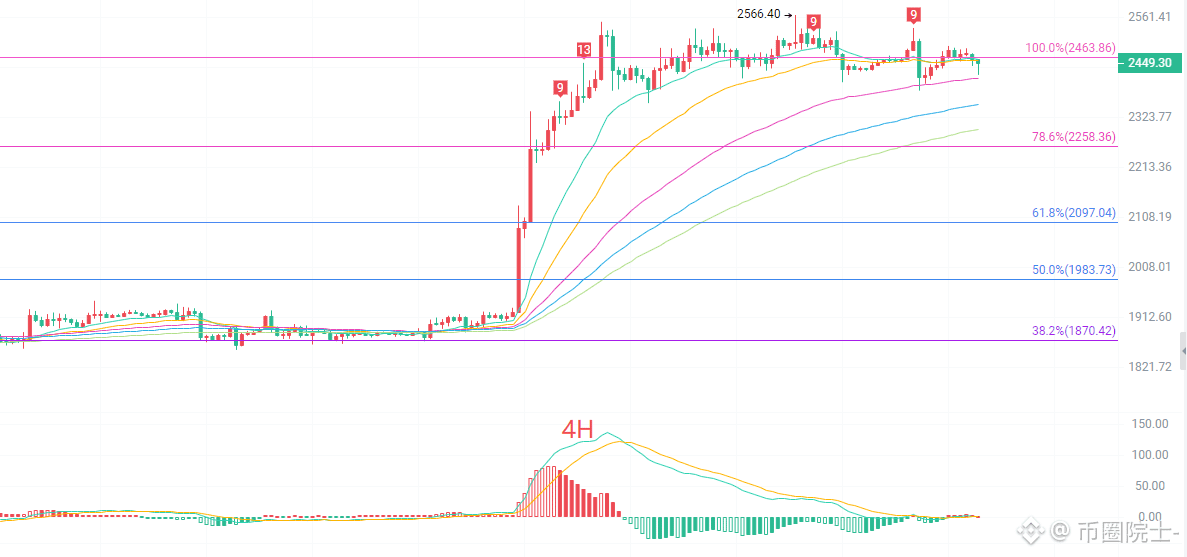
The four-hour (四小时) K-line is being pulled back and forth in the 2463 2421 range, which is a sideways digestion pattern after the rally. The EMA moving average cluster remains upward; the short-term averages are intertwined and flattening, indicating that bull and bear power is relatively balanced. The Bollinger Bands are beginning to tighten, meaning volatility is narrowing and the market is about to choose a direction. MACD is running above the zero line; red and green bars alternate without forming a clear one-sided momentum. The strong resistance above at 2463 corresponds to the 100% Fibonacci extension; it has been tested multiple times but couldn’t hold. The first support below at 2415 is near the lower band of the Bollinger Bands; strong support is the 78.6% retracement at 2258. The four-hour chart has not yet shown a breakdown signal. This is still high-range box consolidation. Without an effective breakout above/below the boundaries, the risk of chasing trades is relatively high; prioritize waiting for price to touch key resistance/support before responding.
Short-term reference
From 2440 to 2410: as long as it doesn’t break north, cut loss at 40 points, targets look at 2530 to 2620
From 2540 to 2560: as long as it doesn’t break south, cut loss at 40 points, targets look at 2500 to 2450
#ETH走势分析
Ethereum’s current price is 2449. Unsure of direction? If it rises a bit, you fear a spike followed by a pullback; if it drops a bit, you worry the big move hasn’t finished yet. Chasing back and forth to cut losses is extremely torturous. This leg of the rally from the lows has been sizable. Bulls have built up a large amount of profit-taking. The chart is no longer one-way mindless上涨; the game between bulls and bears is intensifying. Many people are stuck debating whether to keep going long in the same direction or to set up short positions on rallies—because you missed the chance to go north with me from the low, and that’s why you’re left feeling uncertain and uneasy.
The daily (日K) candle pullback has entered a high-level consolidation range. The moving average system remains in a bullish alignment, with the short-term EMA15 and EMA30 lines forming support below, indicating that the larger-scale uptrend hasn’t been directly broken. The Bollinger Bands are opening upward, and price is oscillating near the upper band. The MACD histogram red bars are gradually shrinking; DIF and DEA remain above the zero line, but bullish momentum is weakening. The main resistance above is concentrated at 2566, the prior high. This is a key checkpoint for this rally; if it cannot break through effectively, it will continue to face pressure and pull back. Key support below is around 2242, the 78.6% Fibonacci level. Once this level breaks, the space for daily-level pullbacks will open up further.
The four-hour (四小时) K-line is being pulled back and forth in the 2463 2421 range, which is a sideways digestion pattern after the rally. The EMA moving average cluster remains upward; the short-term averages are intertwined and flattening, indicating that bull and bear power is relatively balanced. The Bollinger Bands are beginning to tighten, meaning volatility is narrowing and the market is about to choose a direction. MACD is running above the zero line; red and green bars alternate without forming a clear one-sided momentum. The strong resistance above at 2463 corresponds to the 100% Fibonacci extension; it has been tested multiple times but couldn’t hold. The first support below at 2415 is near the lower band of the Bollinger Bands; strong support is the 78.6% retracement at 2258. The four-hour chart has not yet shown a breakdown signal. This is still high-range box consolidation. Without an effective breakout above/below the boundaries, the risk of chasing trades is relatively high; prioritize waiting for price to touch key resistance/support before responding.
Short-term reference
From 2440 to 2410: as long as it doesn’t break north, cut loss at 40 points, targets look at 2530 to 2620
From 2540 to 2560: as long as it doesn’t break south, cut loss at 40 points, targets look at 2500 to 2450
#ETH走势分析