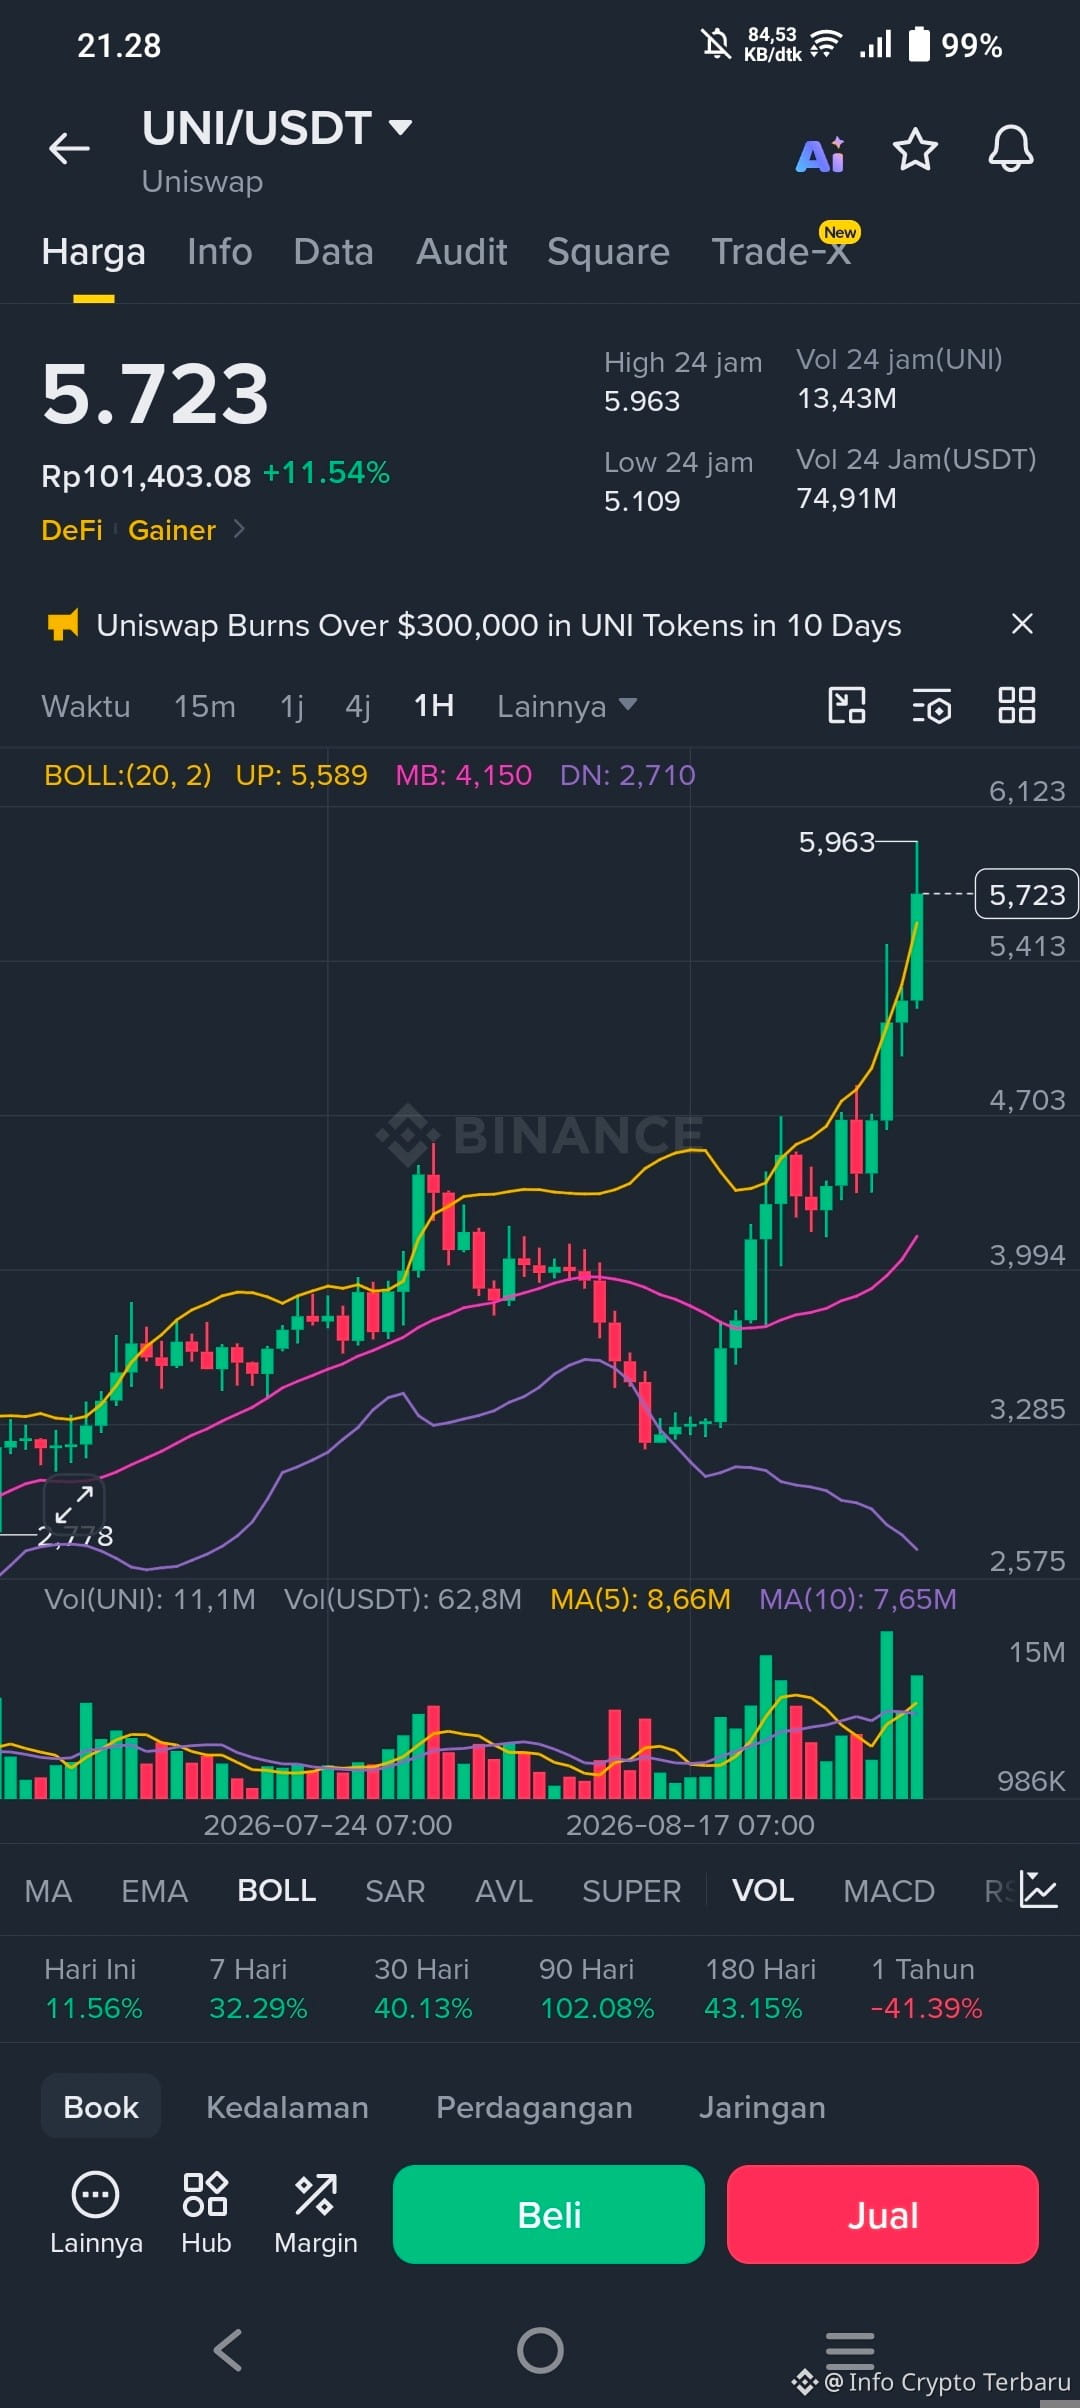
$UNI Uniswap is traded at $5.72, extending the solid bullish phase after reclaiming all of the main Exponential Moving Averages (EMAs), which indicates a strongly supported uptrend structure. The declining resistance trendline, which was breached near $3.89, has turned into an additional base, while the Relative Strength Index (RSI) at 78 signals overbought conditions.
🔥Uniswap (UNI) maintains a strong bullish outlook, trading at $5.72 and rising more than 10% on Tuesday. This original token of the decentralized exchange (DEX) has recorded four consecutive days of gains, supporting a solid technical structure.
❓A breakout above $6.00 could help confirm bullish control, while consolidation below that level may encourage profit-taking and increase the chances of a correction.
At the same time, the Moving Average Convergence Divergence (MACD) continues to hold a bullish histogram, strengthening the momentum of the strong upmove while hinting that the rise may already be too far in the short term.
⛔Initial support is in the latest breakout zone set by the 50-day EMA around $4.02, followed by the 200-day EMA around $3.96 and the breakthrough of the declining resistance trendline near $3.89, with the 100-day EMA further below at around $3.78.
📈Even though the current daily chart does not show any clearly defined resistance above, the overbought RSI suggests UNI may consolidate or correct before attempting a new rally, with a pullback expected to find buyers as it approaches the clustered EMA support bands.
#ARBRises30%OnRobinhoodChainRevenue StrategySpends$635MOnSTRCPreferredBuybacks$SOMI $ZORA
🔥Uniswap (UNI) maintains a strong bullish outlook, trading at $5.72 and rising more than 10% on Tuesday. This original token of the decentralized exchange (DEX) has recorded four consecutive days of gains, supporting a solid technical structure.
❓A breakout above $6.00 could help confirm bullish control, while consolidation below that level may encourage profit-taking and increase the chances of a correction.
At the same time, the Moving Average Convergence Divergence (MACD) continues to hold a bullish histogram, strengthening the momentum of the strong upmove while hinting that the rise may already be too far in the short term.
⛔Initial support is in the latest breakout zone set by the 50-day EMA around $4.02, followed by the 200-day EMA around $3.96 and the breakthrough of the declining resistance trendline near $3.89, with the 100-day EMA further below at around $3.78.
📈Even though the current daily chart does not show any clearly defined resistance above, the overbought RSI suggests UNI may consolidate or correct before attempting a new rally, with a pullback expected to find buyers as it approaches the clustered EMA support bands.
#ARBRises30%OnRobinhoodChainRevenue StrategySpends$635MOnSTRCPreferredBuybacks$SOMI $ZORA