So, as you could have predicted Bitcoin’s movement?
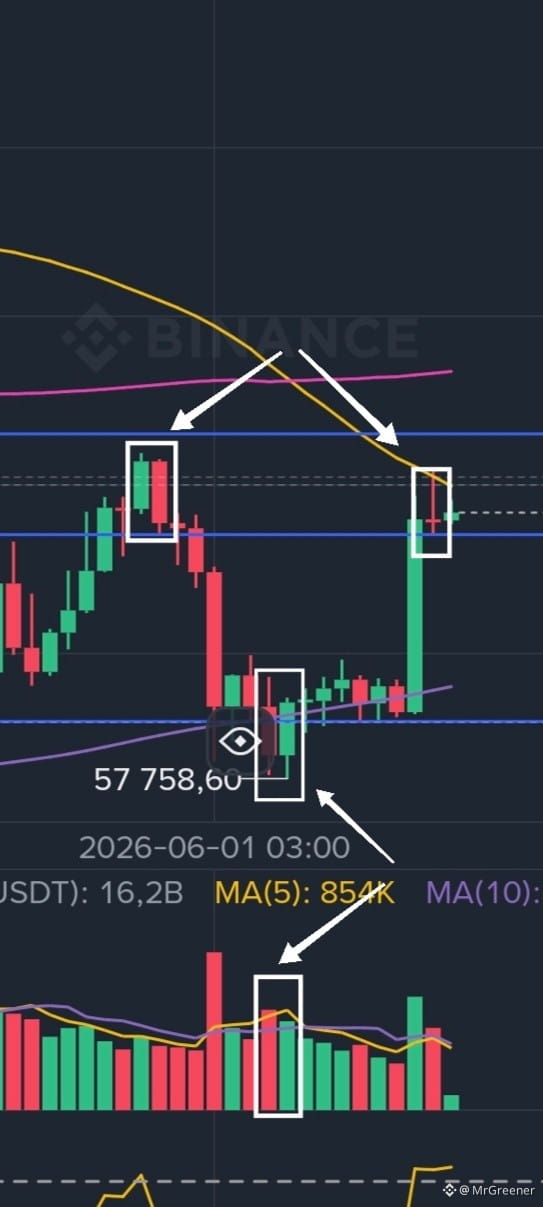
A weekly time frame: the price is in a resistance zone, and we see a great absorption from the level 57758.60, accompanied by almost an identical volume to the absorbed candle. That’s one.
A complex breakout of the MA 200 and a return with confirmation on the weekly time frame. That’s two. Pure PA and VSA.
What are our actions at that moment when we don’t know what will happen next? It’s simple—we try to enter within the green weekly candle with a clear stop.
We move to the daily chart.
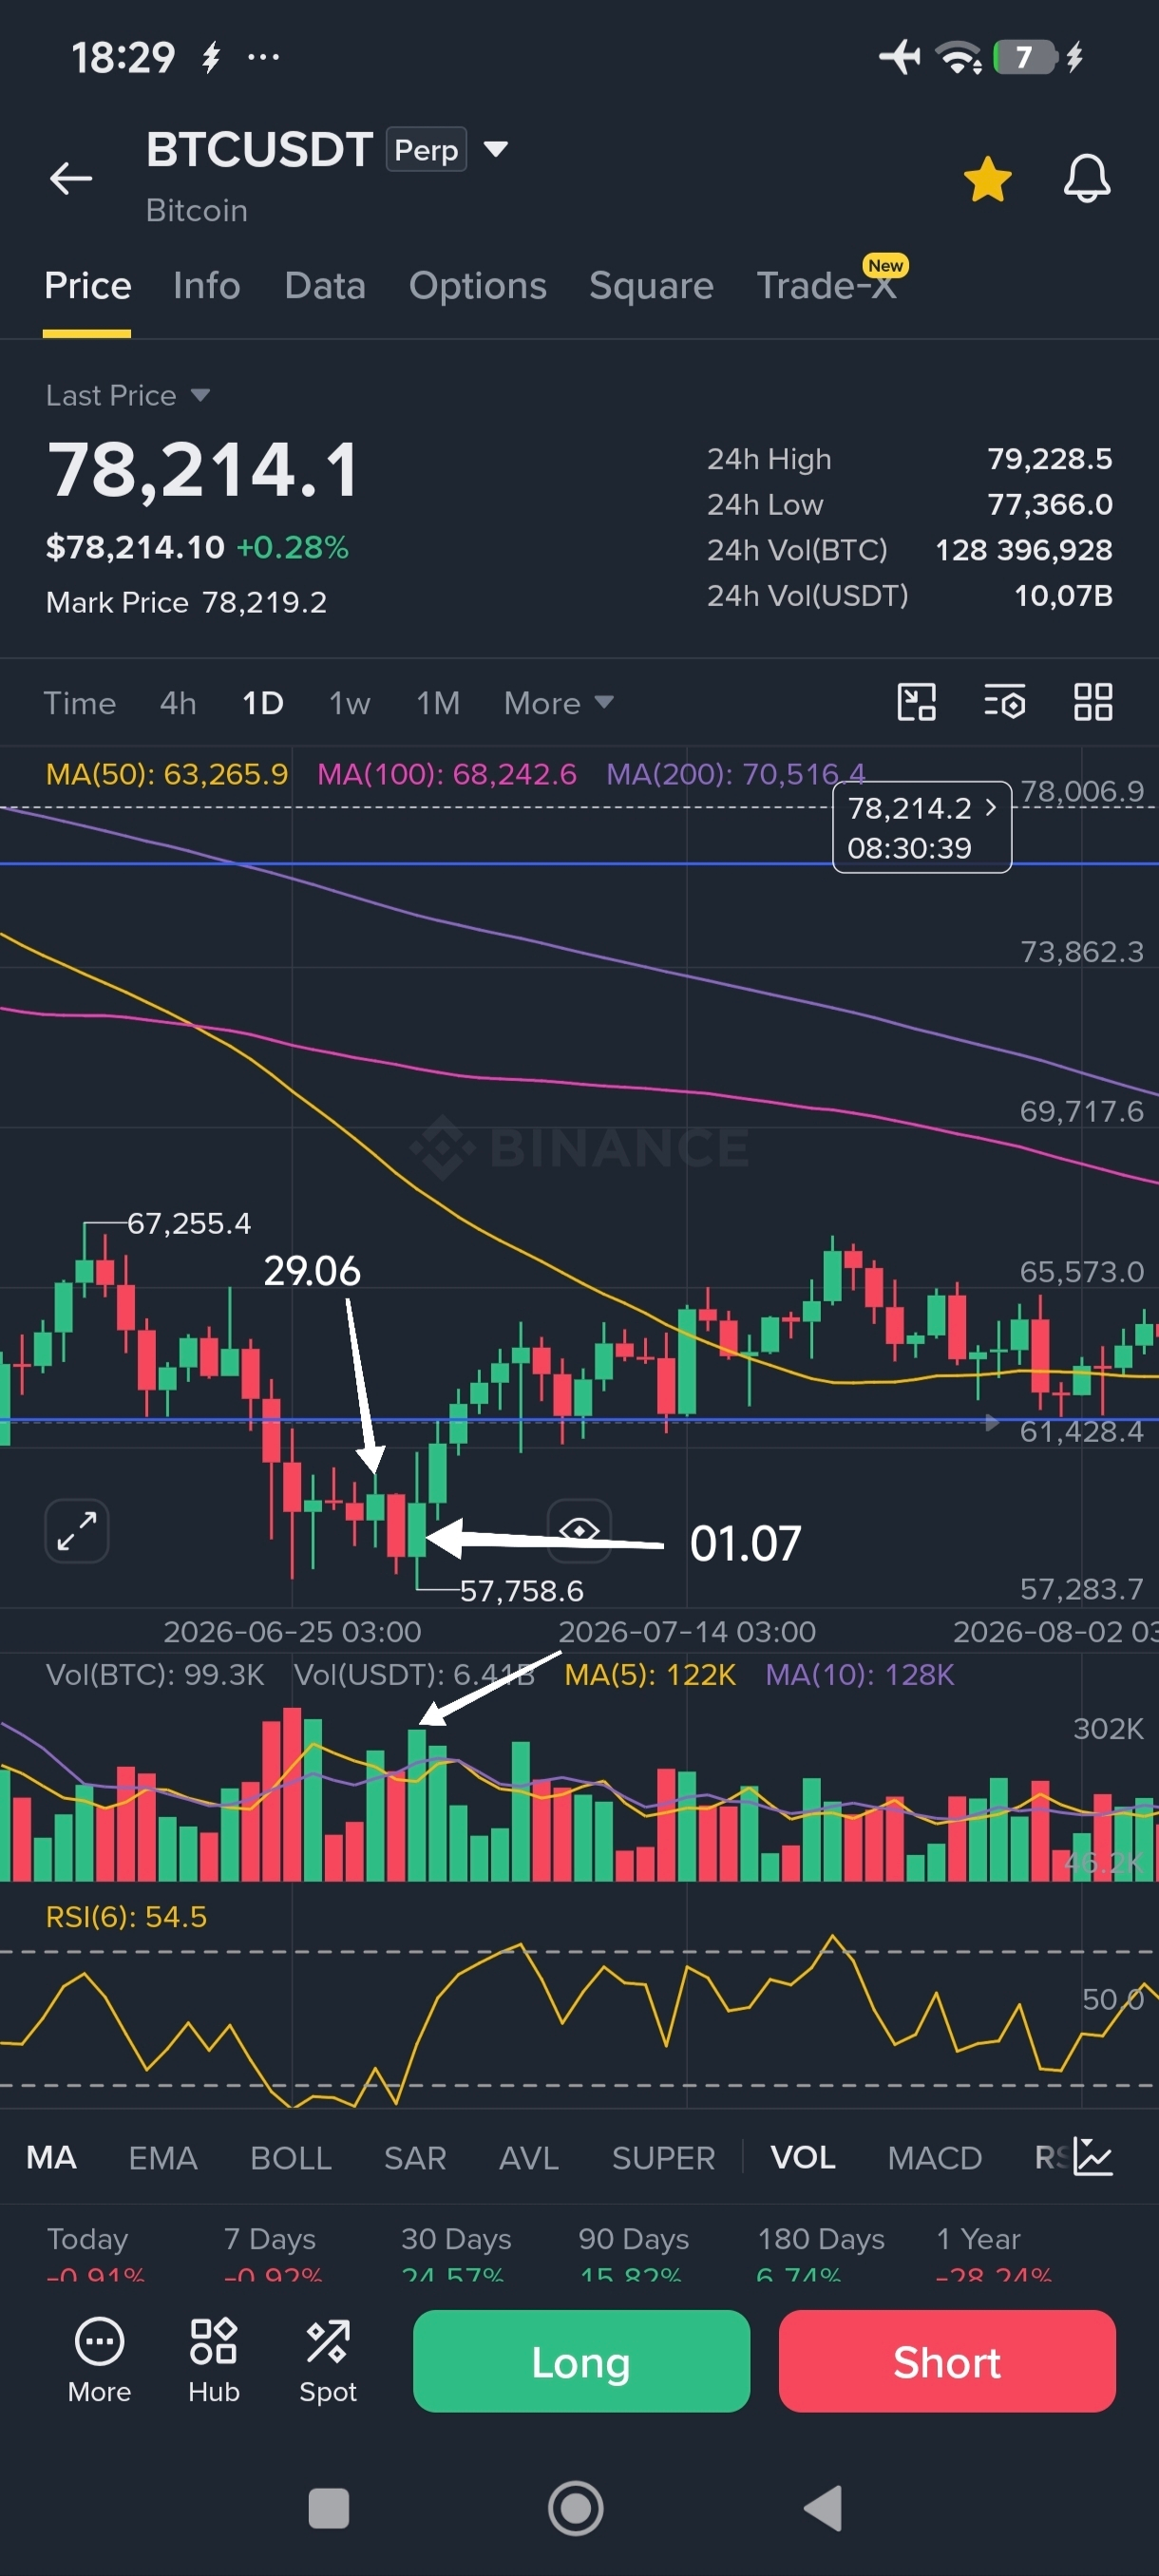
The week closed on 29.06, and already on 01.07 we get a good candle with volume. Entry around 60000, stop below the candle’s low at about 57600.
Yes, you had to hold for about 2 months.
Don’t overcomplicate it, it’s simple.
By the way, I don’t recommend going long right now.
Either through a pullback to the MA averages, or after a breakout
with confirmation at 82830. Technically, Bitcoin is in a bearish trend on the week. And the daily time frame is forming near resistance a not-so-pleasant pattern. A pin bar and absorption with volume.
Good luck, everyone.
A weekly time frame: the price is in a resistance zone, and we see a great absorption from the level 57758.60, accompanied by almost an identical volume to the absorbed candle. That’s one.
A complex breakout of the MA 200 and a return with confirmation on the weekly time frame. That’s two. Pure PA and VSA.
What are our actions at that moment when we don’t know what will happen next? It’s simple—we try to enter within the green weekly candle with a clear stop.
We move to the daily chart.
The week closed on 29.06, and already on 01.07 we get a good candle with volume. Entry around 60000, stop below the candle’s low at about 57600.
Yes, you had to hold for about 2 months.
Don’t overcomplicate it, it’s simple.
By the way, I don’t recommend going long right now.
Either through a pullback to the MA averages, or after a breakout
with confirmation at 82830. Technically, Bitcoin is in a bearish trend on the week. And the daily time frame is forming near resistance a not-so-pleasant pattern. A pin bar and absorption with volume.
Good luck, everyone.