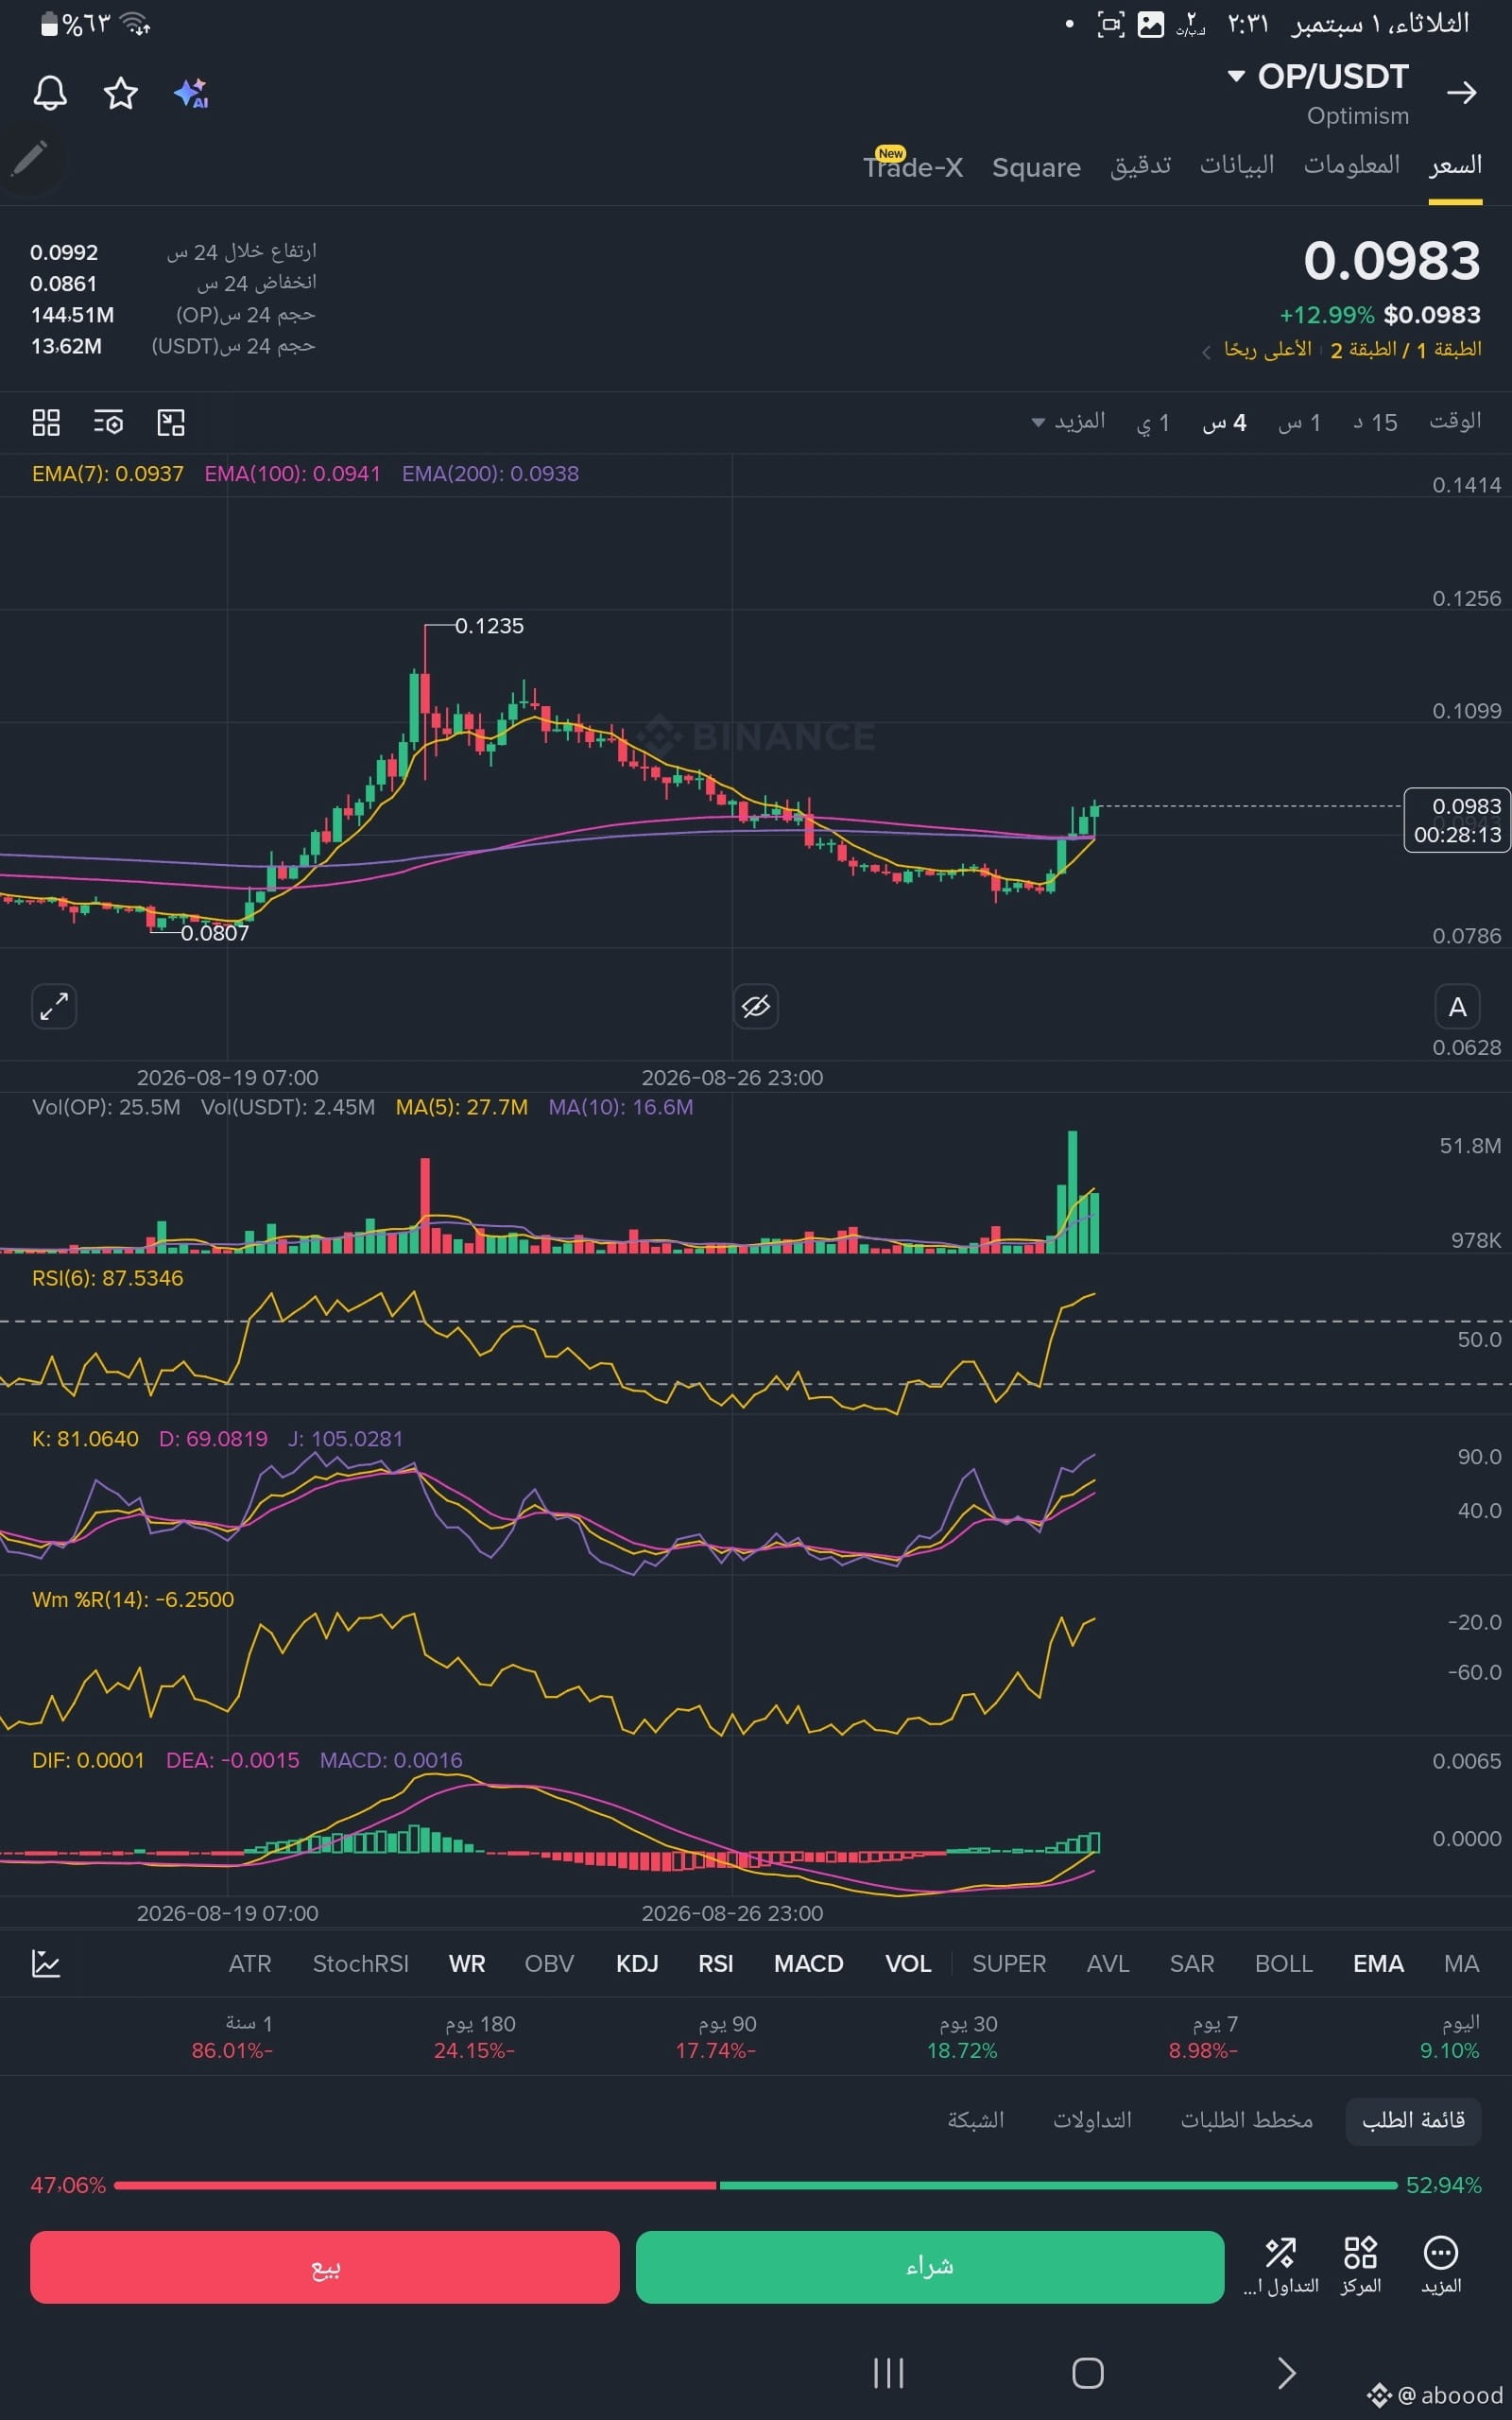
📊 Technical update for the $OP coin | Strong breakout and explosive liquidity! 🚀
OP has seen a strong rise of roughly 13%+ and is trading around 0.0983, successfully breaking above the moving average lines (EMA 7, 100, 200). We also notice a massive jump in trading volume, while the RSI indicator has entered an extreme overbought condition at 87.5—reflecting intense and sudden bullish momentum.
Here are 3 anticipated scenarios for the next move:
🟢 Bullish scenario (positive continuation):
The price is currently trading above the EMA 7 line at 0.0937. Maintaining this momentum above the 0.0950 levels and closing the day above them will open the door directly to testing the resistance area and the previous peak around 0.1235.
🔴 Bearish scenario (correction and profit-taking):
Due to the rapid vertical surge and the inflated RSI, a pullback is expected to relieve pressure. The key support levels cluster in a very narrow zone between the EMA 100 line at 0.0941 and the stronger EMA 200 line at 0.0938.
🟡 Sideways scenario (consolidation):
Price stability and movement in a sideways range between 0.0950 and 0.1000 for a few days. This scenario is ideal for cooling down overly inflated indicators and building a solid support base, setting the stage for a more sustainable and safer upward breakout.
💡 Trading tip: RSI is significantly inflated, which requires extra caution. Always stick to risk management and enable stop-loss orders to protect your portfolio.
💬 Share your thoughts: Will $OP keep pushing toward 0.12, or will we see a correction? 👇
OP has seen a strong rise of roughly 13%+ and is trading around 0.0983, successfully breaking above the moving average lines (EMA 7, 100, 200). We also notice a massive jump in trading volume, while the RSI indicator has entered an extreme overbought condition at 87.5—reflecting intense and sudden bullish momentum.
Here are 3 anticipated scenarios for the next move:
🟢 Bullish scenario (positive continuation):
The price is currently trading above the EMA 7 line at 0.0937. Maintaining this momentum above the 0.0950 levels and closing the day above them will open the door directly to testing the resistance area and the previous peak around 0.1235.
🔴 Bearish scenario (correction and profit-taking):
Due to the rapid vertical surge and the inflated RSI, a pullback is expected to relieve pressure. The key support levels cluster in a very narrow zone between the EMA 100 line at 0.0941 and the stronger EMA 200 line at 0.0938.
🟡 Sideways scenario (consolidation):
Price stability and movement in a sideways range between 0.0950 and 0.1000 for a few days. This scenario is ideal for cooling down overly inflated indicators and building a solid support base, setting the stage for a more sustainable and safer upward breakout.
💡 Trading tip: RSI is significantly inflated, which requires extra caution. Always stick to risk management and enable stop-loss orders to protect your portfolio.
💬 Share your thoughts: Will $OP keep pushing toward 0.12, or will we see a correction? 👇