📊 Technical update for an important coin mmmm $ENA
Are you ready for the explosion? 🚀
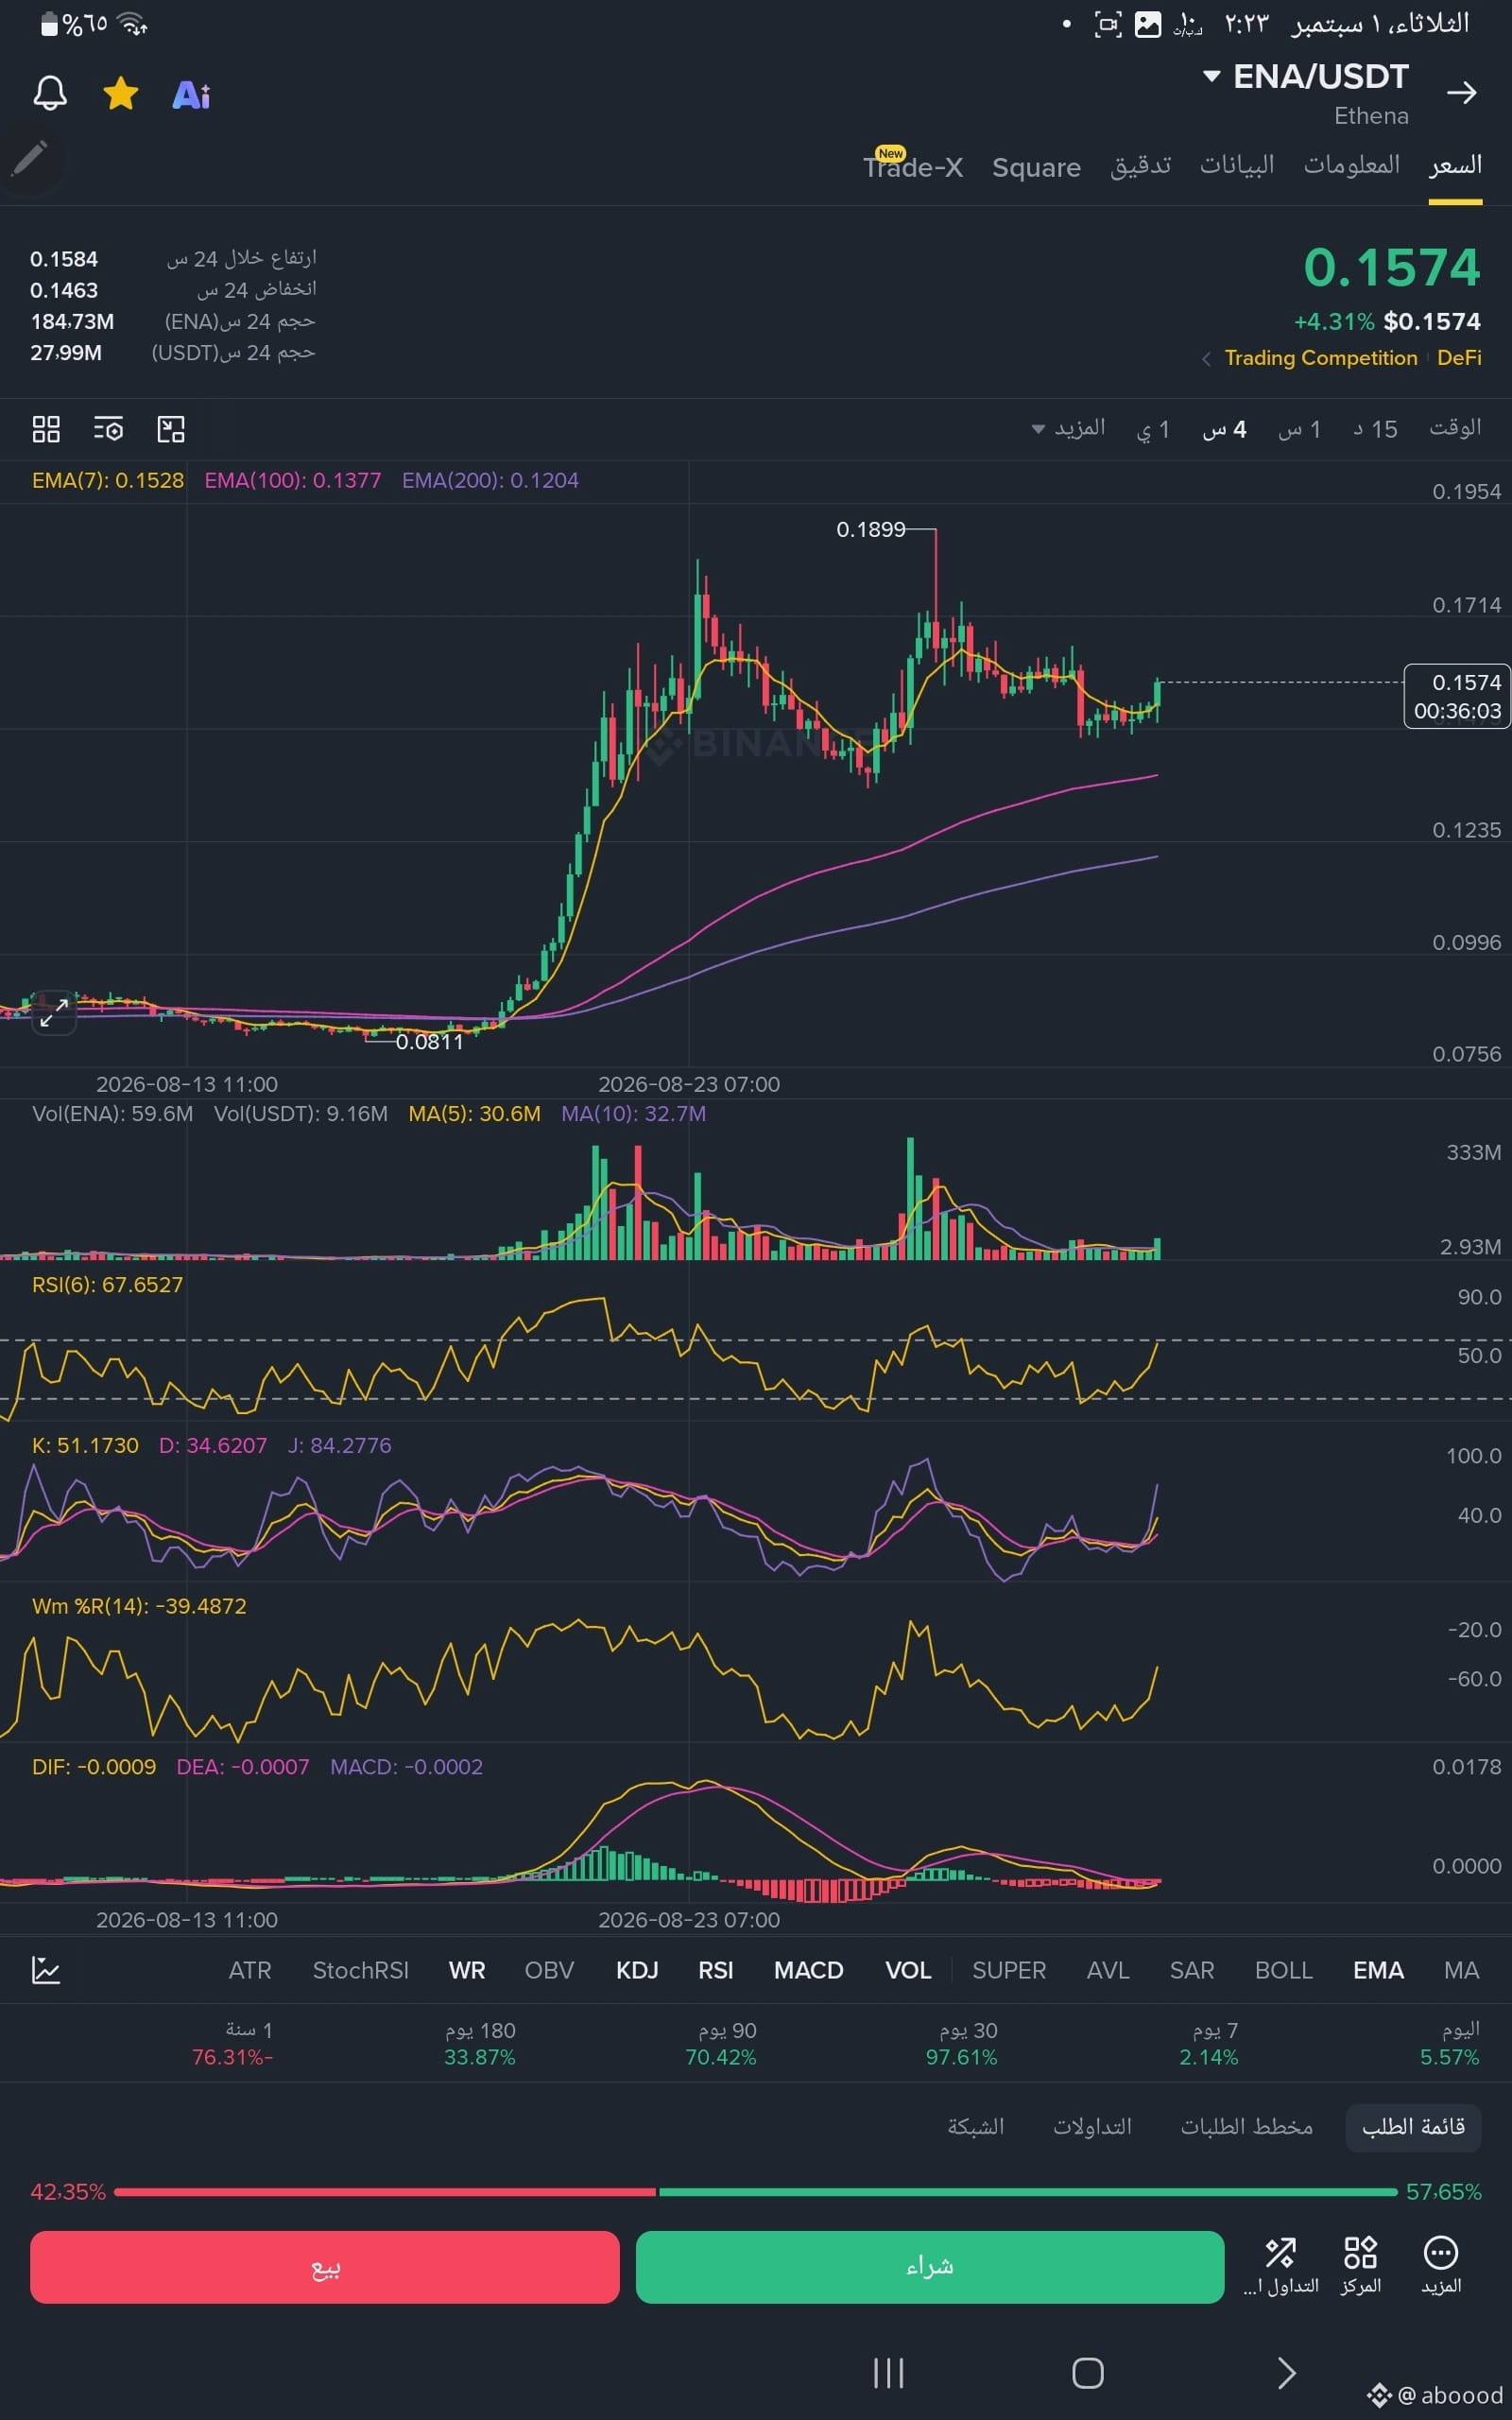
After a strong rally to the 0.1899 peak, the ENA coin is currently consolidating at 0.1574 above the moving averages (EMA 7, 100, 200). This consolidation reflects buyers’ readiness for the next wave.
Here are 3 anticipated scenarios for the next move:
🟢 Bullish scenario (positive continuation):
The price is supported above the EMA 7 line at 0.1528. A breakout through the 0.1650 resistance and holding above it would pave the way to revisit the previous high at 0.1899. With liquidity support, the coin may move toward nearby targets around 0.2100.
🔴 Bearish scenario (correction and profit-taking):
If momentum weakens and the price fails to break out, it may dip to retest stronger support zones. The first support is at the EMA 100 line estimated at 0.1377, followed by stronger support at the EMA 200 line at 0.1204.
🟡 Sideways scenario (accumulation):
The price moves sideways between 0.1500 and 0.1650 for a few days. This scenario is excellent for market makers to accumulate additional liquidity and calm indicators (Stochastic RSI and MACD) before launching again.
💡 Trading tip: The RSI indicator is stable at 67.6, which provides flexibility for the move. Always stick to risk management and enable a stop-loss.
💬 Share your take: Are we seeing accumulation for the explosion, or a visit to support 0.137? 👇
#EtherETFsExtendInflowStreakTo11Days #GoldFalls5.5%From3MonthHigh #HangSengFalls1%
Are you ready for the explosion? 🚀
After a strong rally to the 0.1899 peak, the ENA coin is currently consolidating at 0.1574 above the moving averages (EMA 7, 100, 200). This consolidation reflects buyers’ readiness for the next wave.
Here are 3 anticipated scenarios for the next move:
🟢 Bullish scenario (positive continuation):
The price is supported above the EMA 7 line at 0.1528. A breakout through the 0.1650 resistance and holding above it would pave the way to revisit the previous high at 0.1899. With liquidity support, the coin may move toward nearby targets around 0.2100.
🔴 Bearish scenario (correction and profit-taking):
If momentum weakens and the price fails to break out, it may dip to retest stronger support zones. The first support is at the EMA 100 line estimated at 0.1377, followed by stronger support at the EMA 200 line at 0.1204.
🟡 Sideways scenario (accumulation):
The price moves sideways between 0.1500 and 0.1650 for a few days. This scenario is excellent for market makers to accumulate additional liquidity and calm indicators (Stochastic RSI and MACD) before launching again.
💡 Trading tip: The RSI indicator is stable at 67.6, which provides flexibility for the move. Always stick to risk management and enable a stop-loss.
💬 Share your take: Are we seeing accumulation for the explosion, or a visit to support 0.137? 👇
#EtherETFsExtendInflowStreakTo11Days #GoldFalls5.5%From3MonthHigh #HangSengFalls1%