


At its core, trading is a game of probabilities. People always look for ways to seek various indicators, and by combining experience and algorithms, they try to tilt the probabilities of this game toward directions that are most favorable to their own trading. Therefore, trading itself isn’t something you do impulsively by throwing dice. An orderly, logical trading system can indeed guide you to achieve positive returns from long-term trading in this market—note that it can only “guide,” not “guarantee.” Gamblers treat probability-based trading in stocks, crypto, and the like as a betting game: with each throw, you either win or lose. A rational trader focuses more on the long-term results of their trading system over the time dimension, rather than on whether any single trade succeeds or fails.
Going back to the title: it’s not that candlesticks “obey indicators.” It’s the same group of people, the same set of rules, and a pile of orders repeatedly battling at the same price levels. Indicators and naked-K resistance/support fundamentally are drawing a map for this clash. So our trading is about looking for useful information from these “maps” to possibly dig up “treasure.” Of course, sometimes the map’s information can also leave you empty-handed — or even lead you into a trap.
First, make the causal relationship clear
Price won’t turn around just because you draw a line. What truly turns is:
Some people place buy orders / sell orders there
Some people set stop-loss orders there
Some people get forcibly liquidated there
Various algorithms automatically execute using the same set of rules, backed by the operation and coordination of institutions
When enough capital uses the same coordinate-based decision system, that coordinate becomes the real supply/demand boundary. This is what’s called self-fulfilling.
This is even more obvious in crypto, because in the short and mid term there’s usually no earnings report/valuation anchor like in stocks. The shared “public coordinate system” people can agree on is mainly the chart. So technical levels aren’t just analysis tools — they’re the market’s common language.
5 mechanisms actually running behind the scenes
—————————————————————————————
1. Price memory: three types of people act at the same place at the same time
A low/high point that’s been tested over and over isn’t a mysterious number — it’s collective memory.
When price returns to prior support, three forces usually show up at the same time:
People who already made money here: add positions or defend
People who didn’t buy last time: “Second chances are here.”
Those who sold at a bad time / got stuck in a bag last time…want to buy back around the original price or get out of the loss
The same logic applies to resistance: take-profit realizations + buyback/selling by trapped holders to regain breakeven + short sellers opening shorts — stack them together and you get a ceiling.
The role reversal follows the same logic: once support is broken effectively, the original buyers become the losing side. When price comes back here again, many people choose, “break even and get out.” That old support becomes new resistance. This isn’t shape-morphology magic; it’s a flip in position P/L state.
Naked K looks “accurate” because it directly marks these memory points: previous highs, previous lows, the edges of a trading range, and the breakout-and-retest levels.
—————————————————————————————
2. Orders cluster: support/resistance first of all is a liquidity map
Retail traders and many quantitative strategies have highly homogeneous order-entry habits:
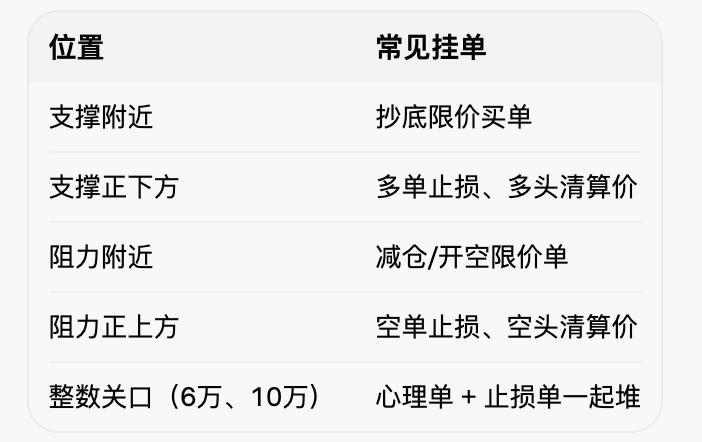
So when you see “it bounces when it hits support,” often it’s: limit-buy orders initially pick up a portion; if they don’t pick them up, it sweeps to the stop-losses, prints a long lower wick, and then you enter with an opposite-direction order.
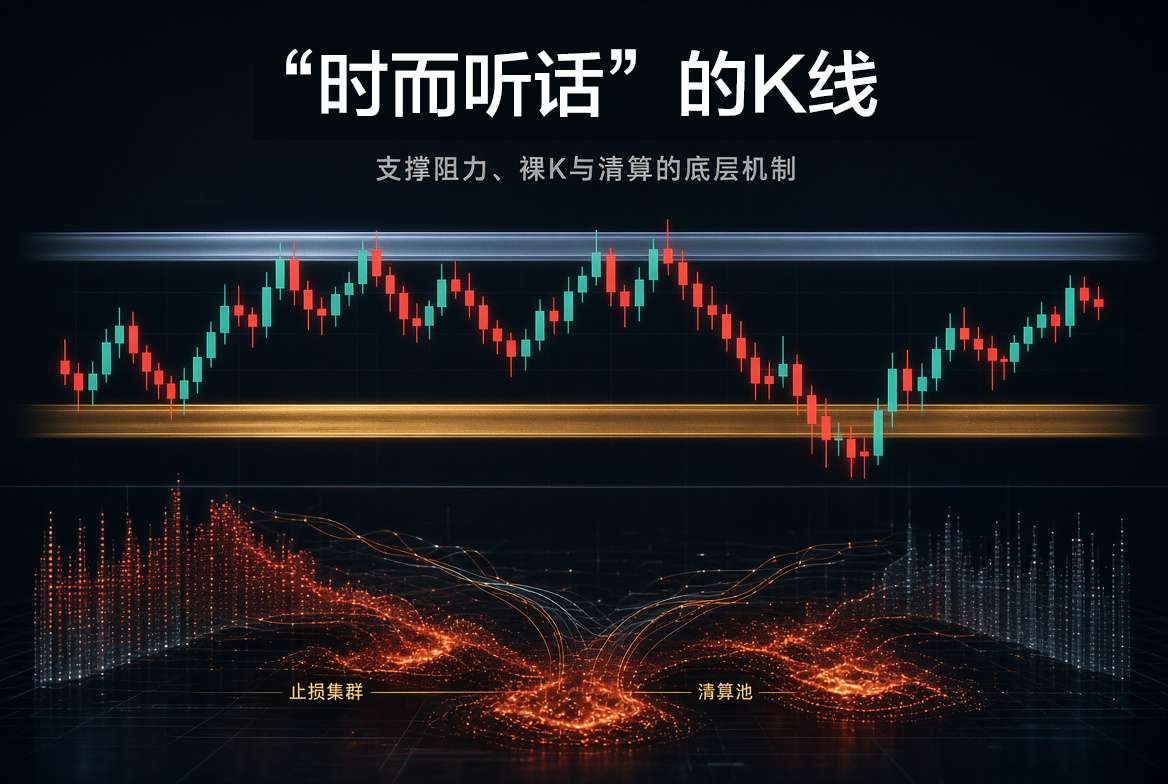
That’s also why professional views treat support and resistance as zones, not a precise line of exactly 1 dollar. Wicks sweep through and then get rejected — often that’s where they’re eating that layer of stop-loss liquidity.
For most of the time, your habits can guide your trading; but highly similar habits, when the market turns against them, can occasionally be used for high-intensity harvesting.
————————————————————————————
3. Leverage and the liquidation engine: crypto’s “mechanical accelerator”
In spot markets, support might be only a group of people willing to buy. In futures, below support there are also forced liquidation orders that can’t be canceled.
The process is mechanical:
Many people open longs at similar prices with similar leverage
Liquidation prices naturally cluster just below “support that looks safe”
Price pushes down, and the first batch of high-multiple leverage gets liquidated
Liquidation is market selling, which keeps smashing the price
It smashes into the next liquidation band, forming a waterfall
Likewise on the other side: shorts stack above resistance, and once it breaks, it turns into fuel for a short squeeze.
So K-lines often show textbook moves like this:
First, fake a dive to pierce support (sweep liquidity)
Instantly pull back (big money gets cheap sell orders)
Then follow the original structure
It looks like naked K is very “accurate,” but actually it’s the liquidation density + stop-loss density being thickest at that position. Heatmaps of liquidations like Coinglass draw exactly this “forced execution map.” It often overlaps with the support/resistance you draw — not a coincidence.
————————————————————————————
4. Algorithms and market makers: embed the “lines everyone can see” into a program
A large number of trading bots run directly by these rules:
Buy on the retest of the moving average / previous low
Trim at resistance
Enter on breakout + retest
After sweeping previous lows/highs, reverse
Market makers and larger funds go one step further: they know retail stops pile up on the outside of the most obvious structures. Since big orders can’t easily eat up that thin order book directly, the least-slippage way is often to push price into the stop-loss cluster first, turning retail stop-losses into their counterparties — then trade in the opposite direction. This is the so-called stop hunt / liquidity sweep.
Also, in extreme conditions, market makers will pull their quotes. The order book suddenly thins out, and support that used to hold can break like paper. After it breaks, if big money re-lists orders to pick up, the chart will again show a naked-K reversal of “pierce then reclaim.”
So what you see in daily trading — “mostly follow indicators/naked K” — is a quiet market where crowded orders dominate. Once liquidity is withdrawn or one-way leverage becomes too heavy, the same lines instantly stop working.
———————————————————————————
5. Indicators are often not independent signals, but a second expression of the same chart
Moving averages, Fibonacci, pivot points, Bollinger Bands — they all calculate prices that have already happened.
They’re “effective,” usually not because some formula has magic, but because:
Too many people stare at the same MA200, the same 0.618
These lines and the structure highs/lows and high-volume congestion zones often overlap
Where they overlap, orders are denser and the reaction is stronger
This is called resonance, not a “predict-the-future” indicator.
After removing indicators, naked-K traders still see the same thing: structure (the arrangement of highs and lows) + location (supply/demand zones) + reaction (engulfing candles, long wicks, pullbacks). Indicators only automate part of it, so you feel like “candlesticks mostly move according to indicators” — because both sides are reading the same order flow.
Why does technical indicator trading have such a big influence in crypto trading?
Weak fundamental anchors: BTC has no PE and no quarterly reports. Short-term pricing relies more on money flow and chart consensus.
High retail share and highly uniform teaching: everyone learns the same support/resistance, breakout-and-retest, MA, and Fib.
24-hour market + high-leverage perpetual futures: price discovery largely happens in the futures, and liquidation can rewrite the move within minutes.
Some coins have thin order books: a relatively small order can push price up into the stop-loss band. So the “sweep first, then go back to the original structure” scenario happens more often.
Integer levels and previous highs/lows have special pull…they’re both psychological levels and magnets for stops/liquidations.
In stocks, earnings reports, macro events, and institutional rebalancing often “interrupt” the technical playbook. In crypto, what interrupts it is more often breaking news, stablecoin depegging, market makers pulling liquidity, and one-way leverage overload. Without these shocks, the public coordinates on the chart get traded repeatedly.
So technical indicator trading works “most of the time,” but it’s not always effective
It’s effective, usually when these conditions are met:
“Horizontal levels” are higher-timeframe structure, not just some random 5-minute line
There have been too many real reactions — not just your subjective line-drawing
Nearby there are volume nodes, integer trigger levels, moving averages, and other resonances
The market doesn’t have one-way leverage overload; the order book is still there
Typical scenarios where it fails:
Major news dumps the market: liquidity vacuum
The liquidation waterfall has already started. The price target becomes the next cluster of liquidation bands, not your line.
Fake breakouts specifically to harvest people who open positions right along the structure, with stops extremely close
Low-liquidity altcoins: the “boss” and market makers can actively paint the chart
Most of the time, crypto candlesticks seem “well-behaved.” It’s not a law of the universe; it’s a closed loop:
Shared habit of reading charts → orders and stop-losses pile up in obvious places → algorithms and leverage execute at the same coordinates → price reacts at those coordinates → the reaction reinforces the belief that “this level works.”
Naked-K support and resistance is the cleanest way to express this closed loop; technical indicators are derivatives of the same closed loop. You’re not trading lines — you’re trading those people behind the lines and that liquidation machine.
That’s why we really need a trading system — a set of technical indicators and methods we’re used to, and we use them to handle most of the trading cycles. After all, we can’t trade only by instinct and random guessing; we need structure. But we also can’t fully trust indicators and the technical side. At the same time, risk control is something everyone must handle themselves.