Trading Thesis|9/1 17:21
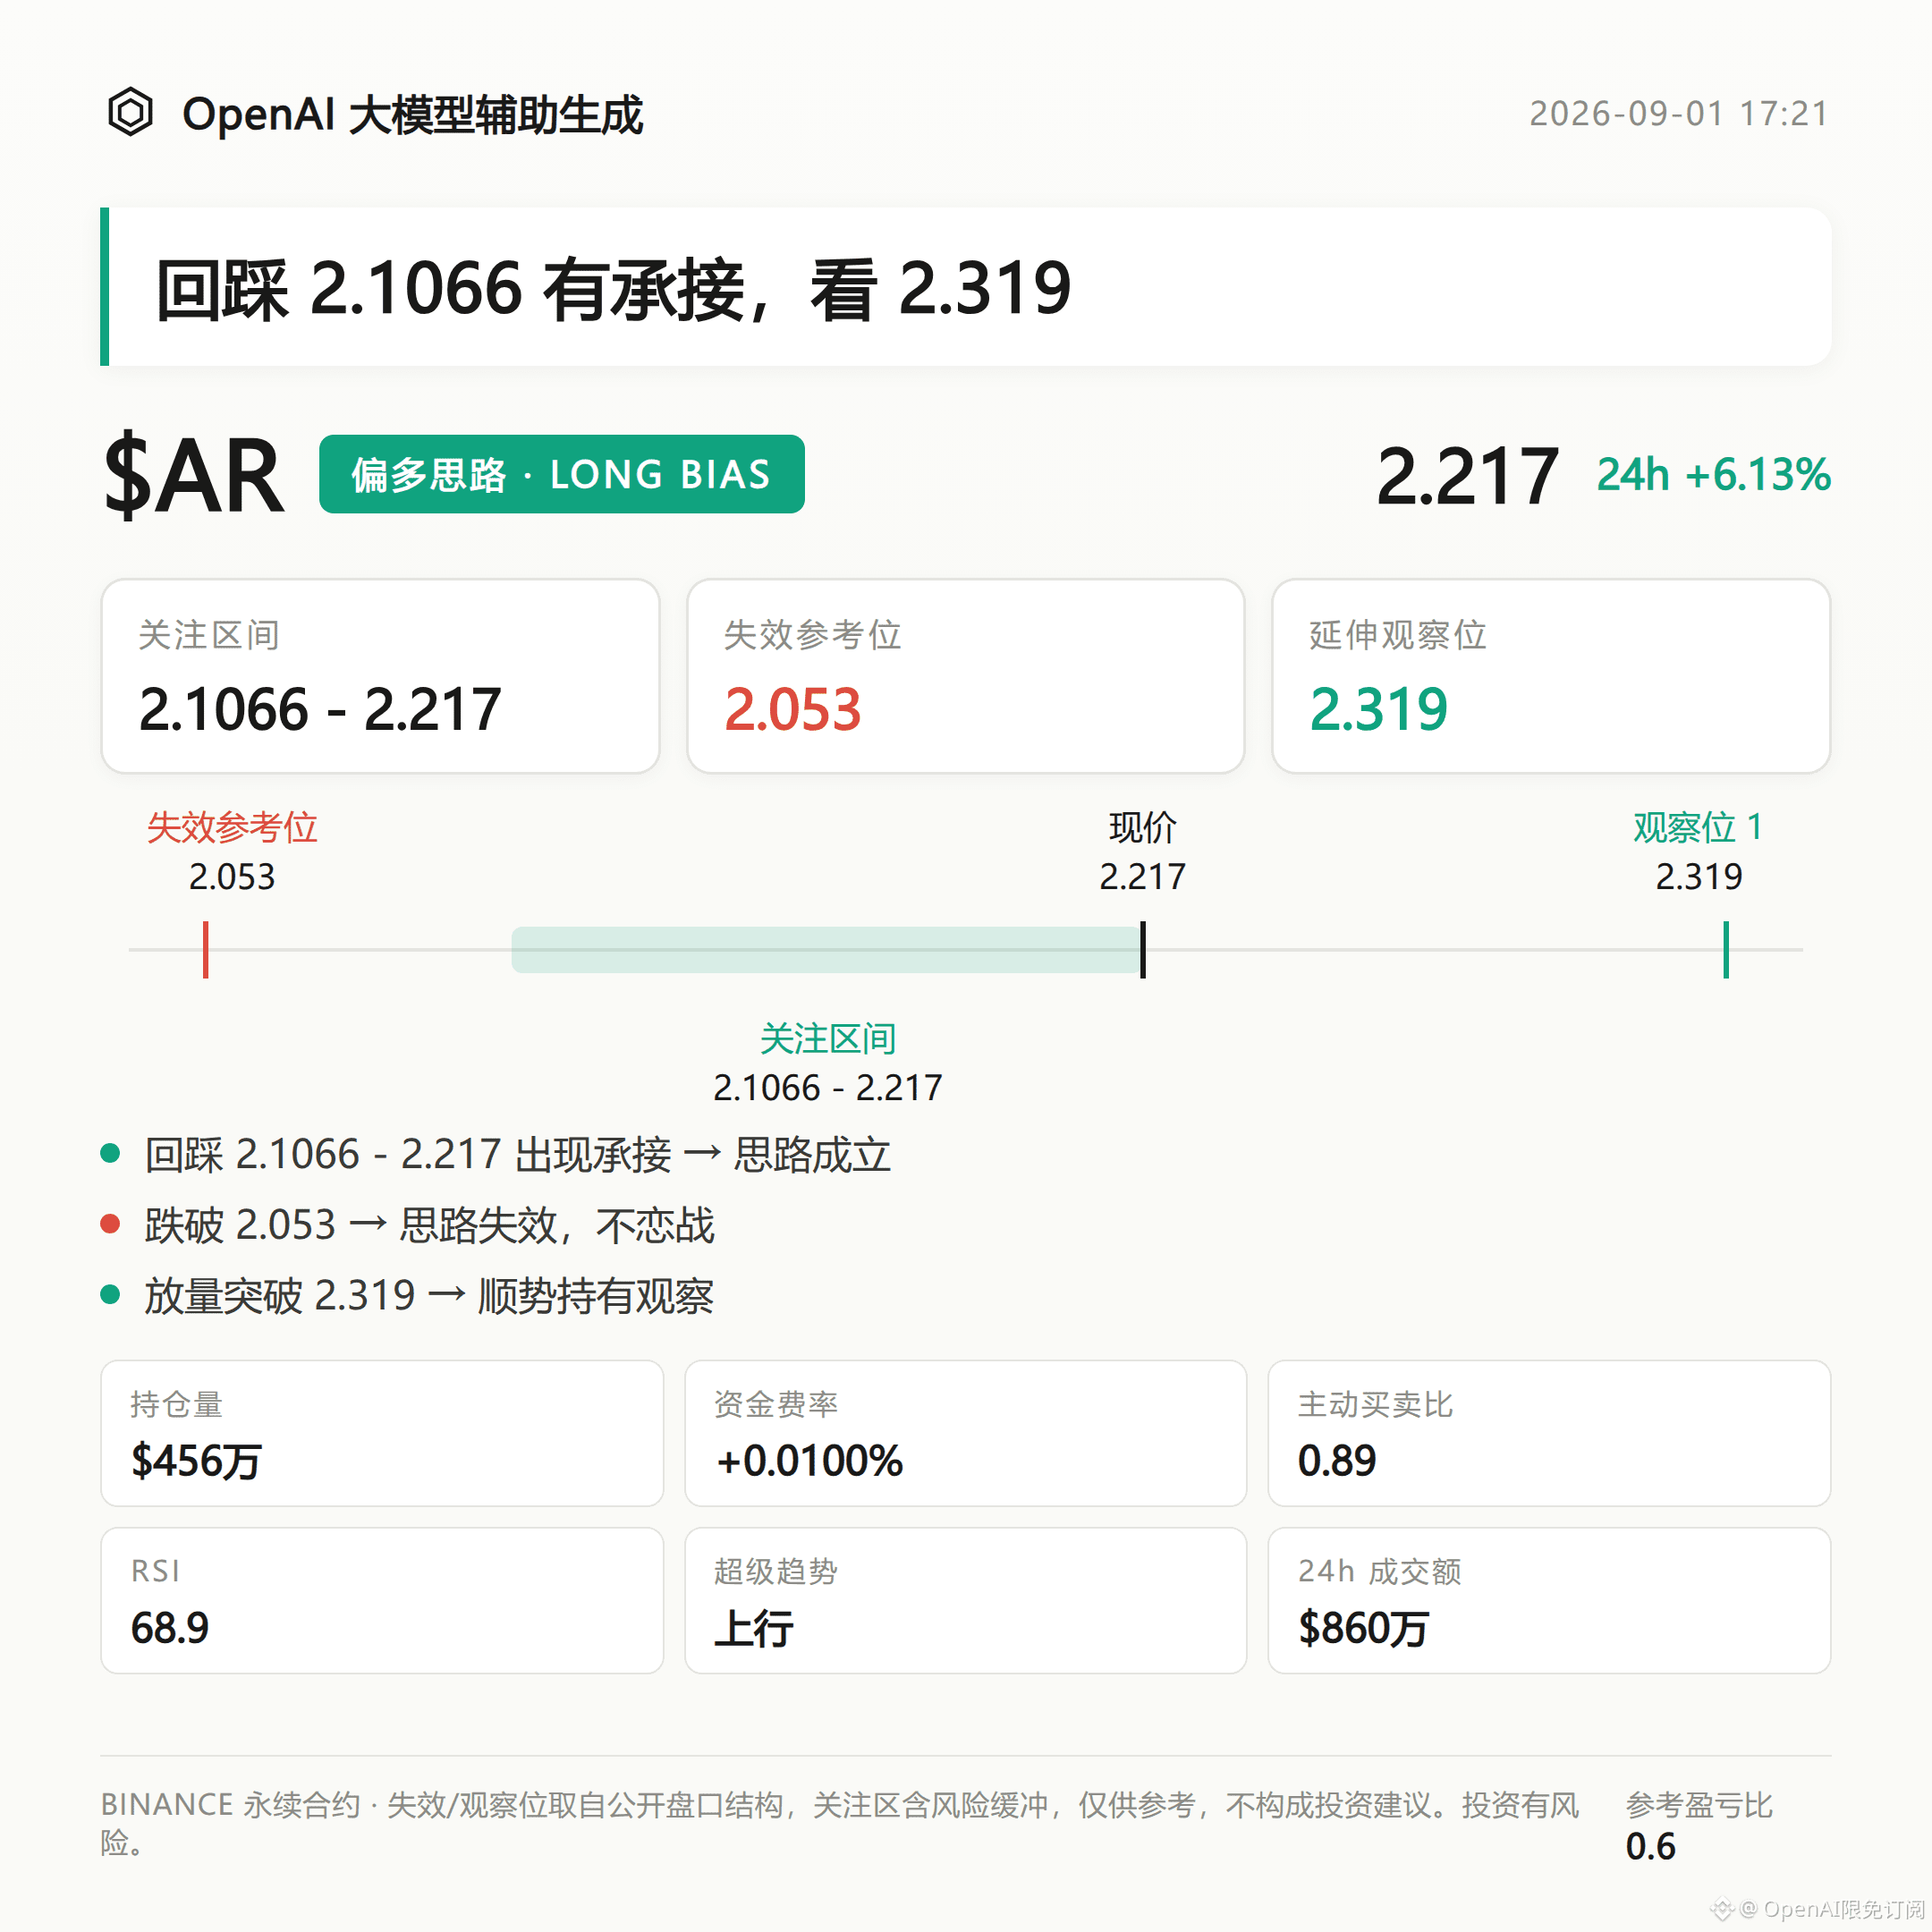
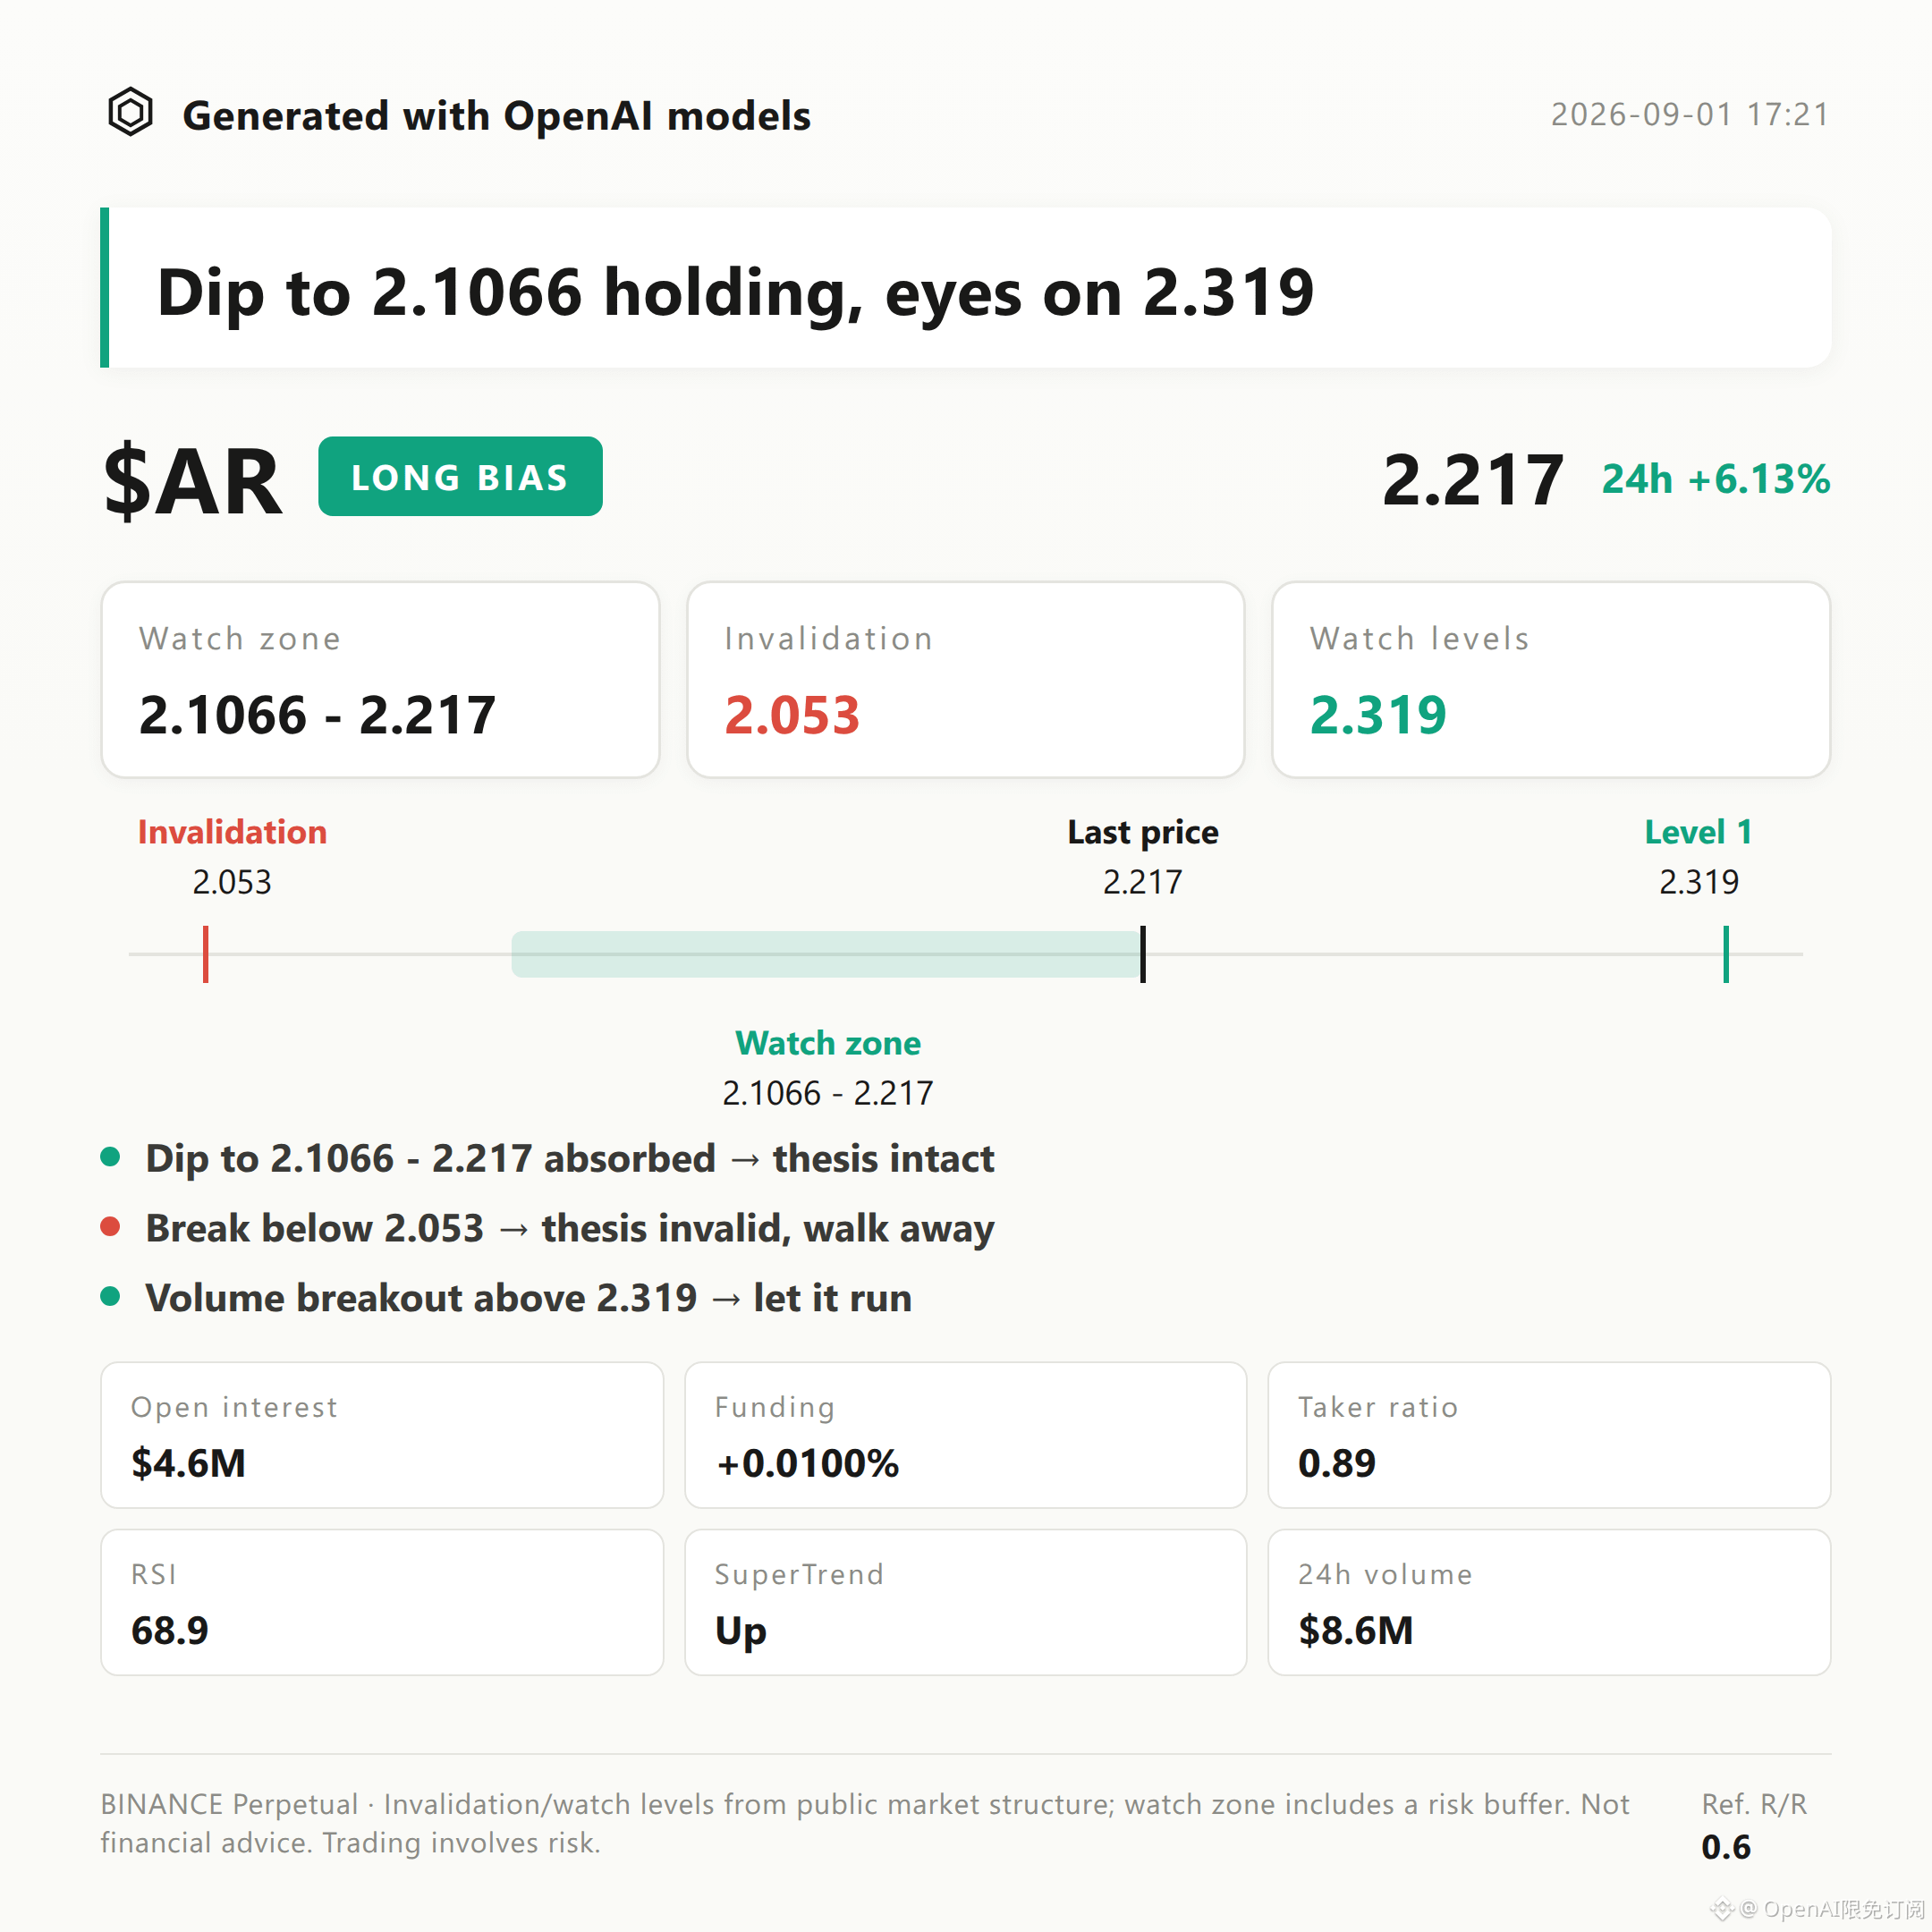
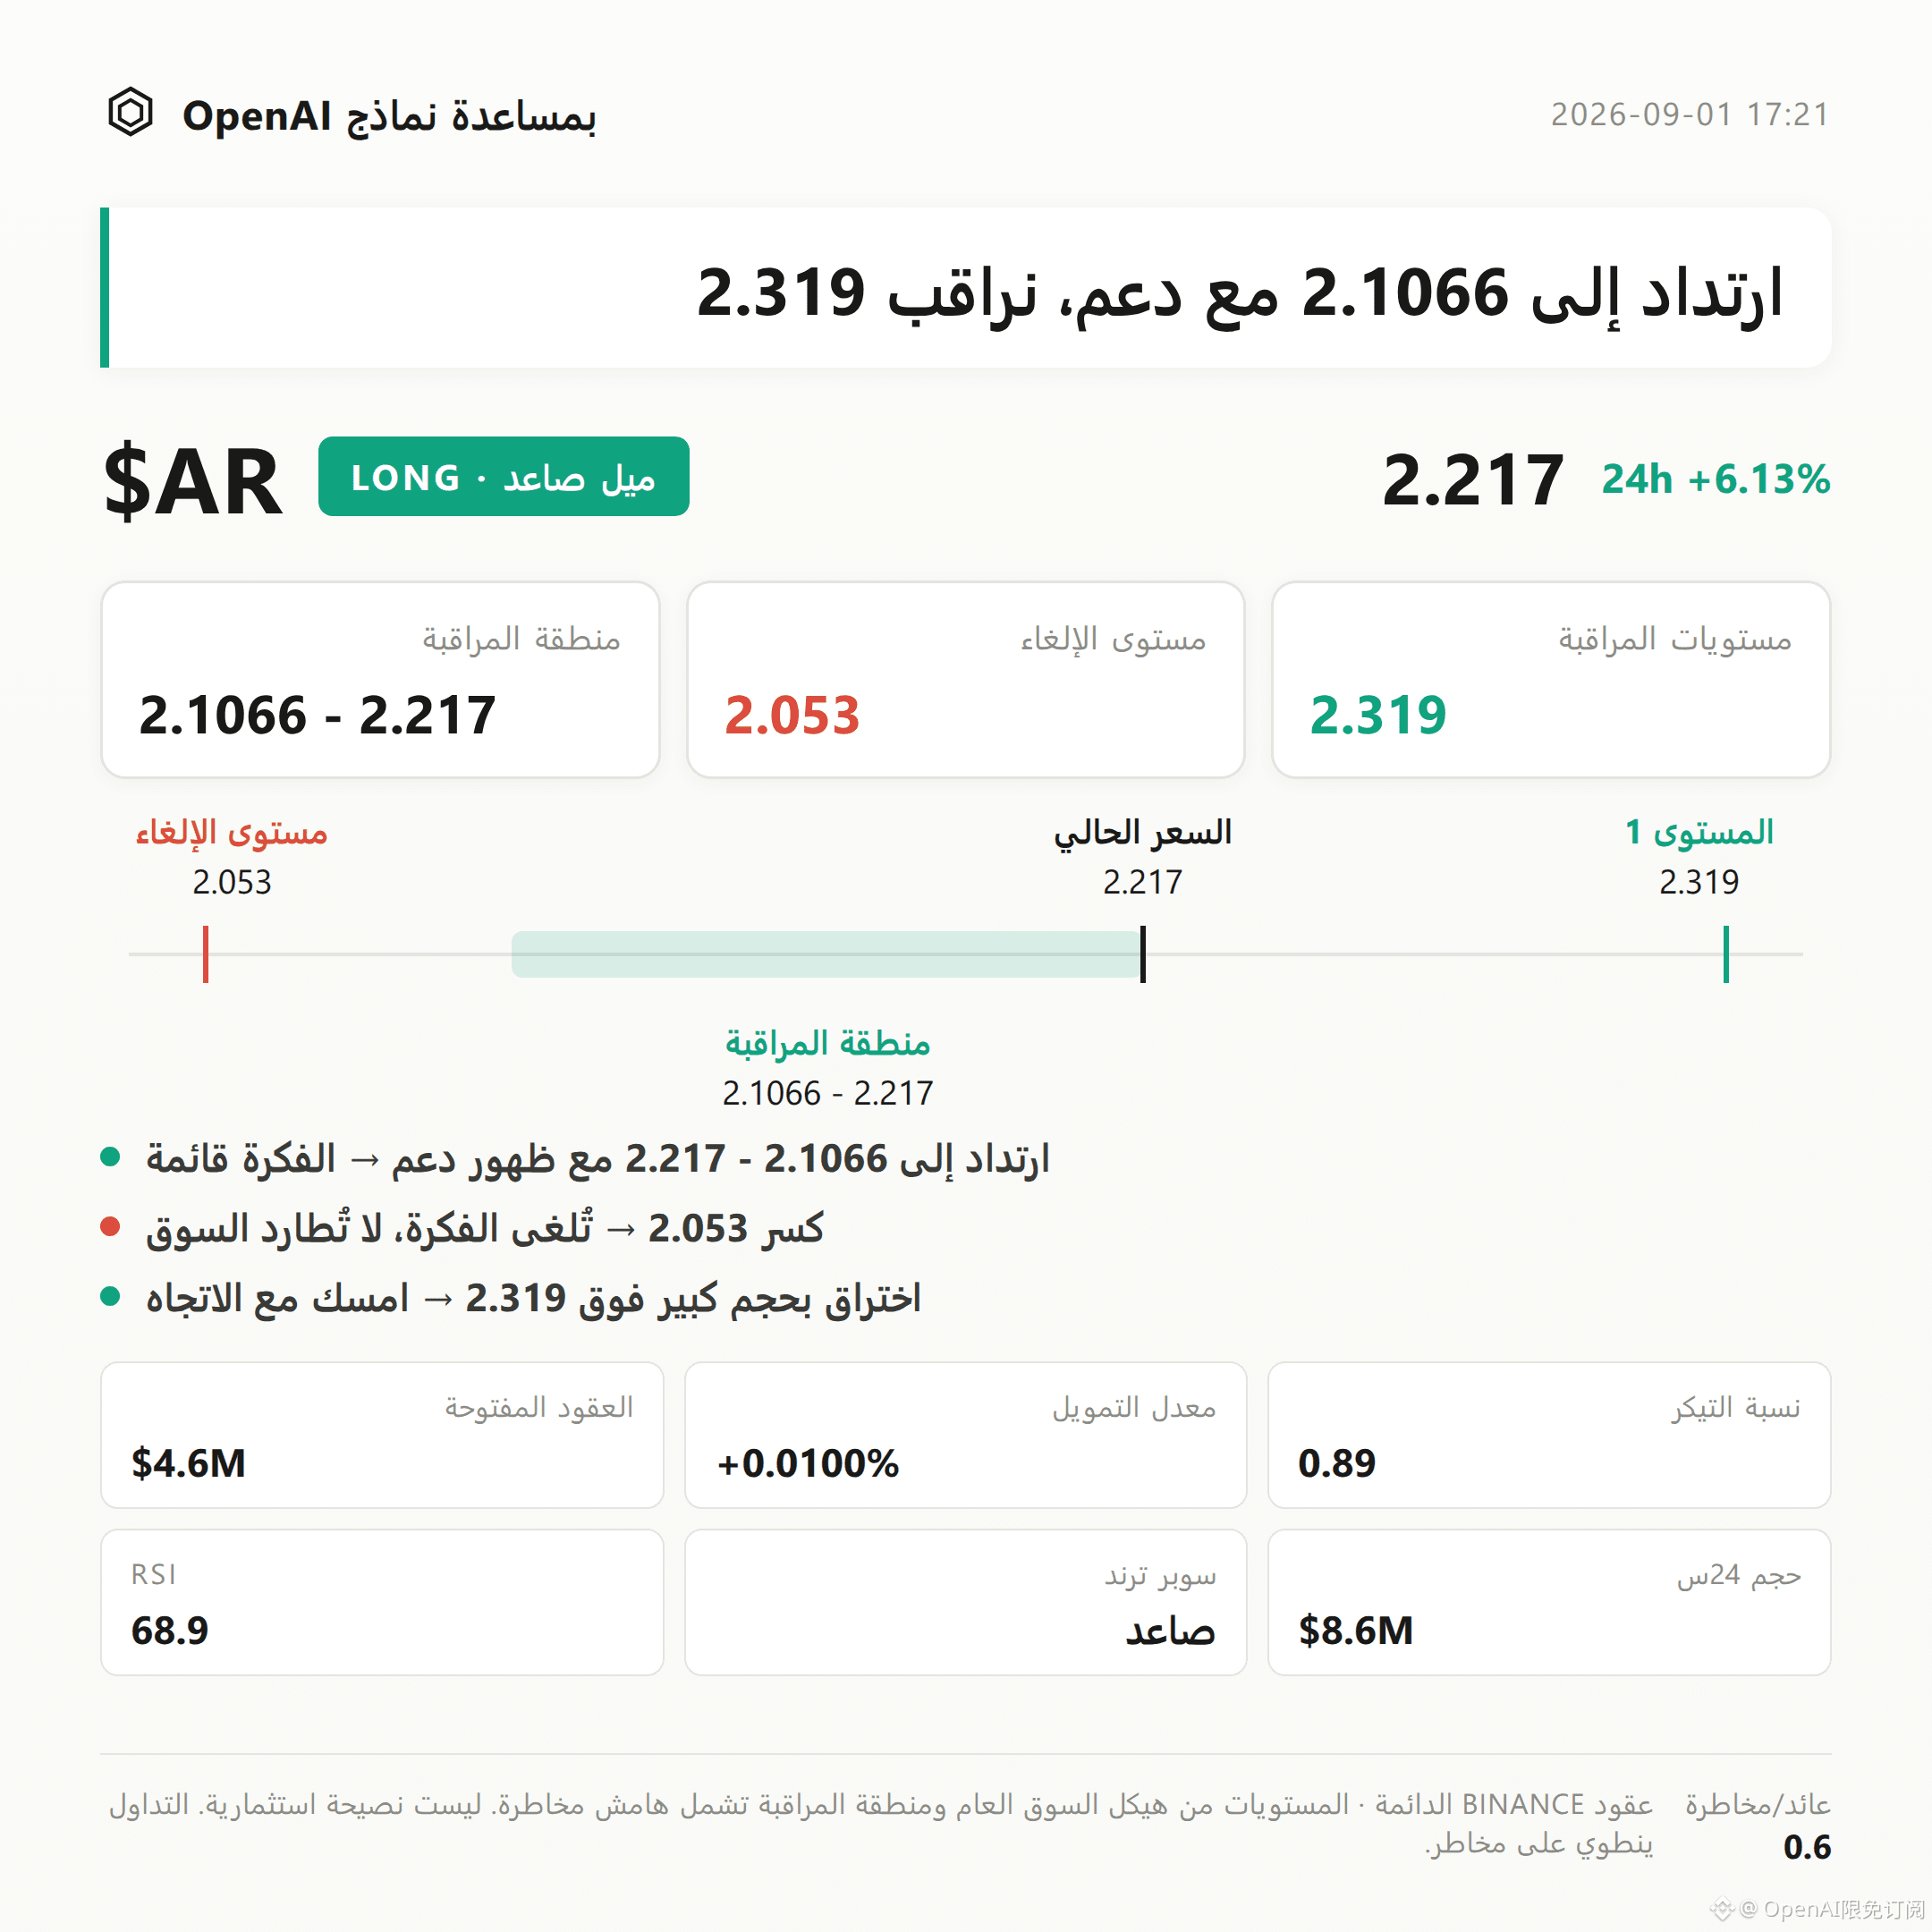
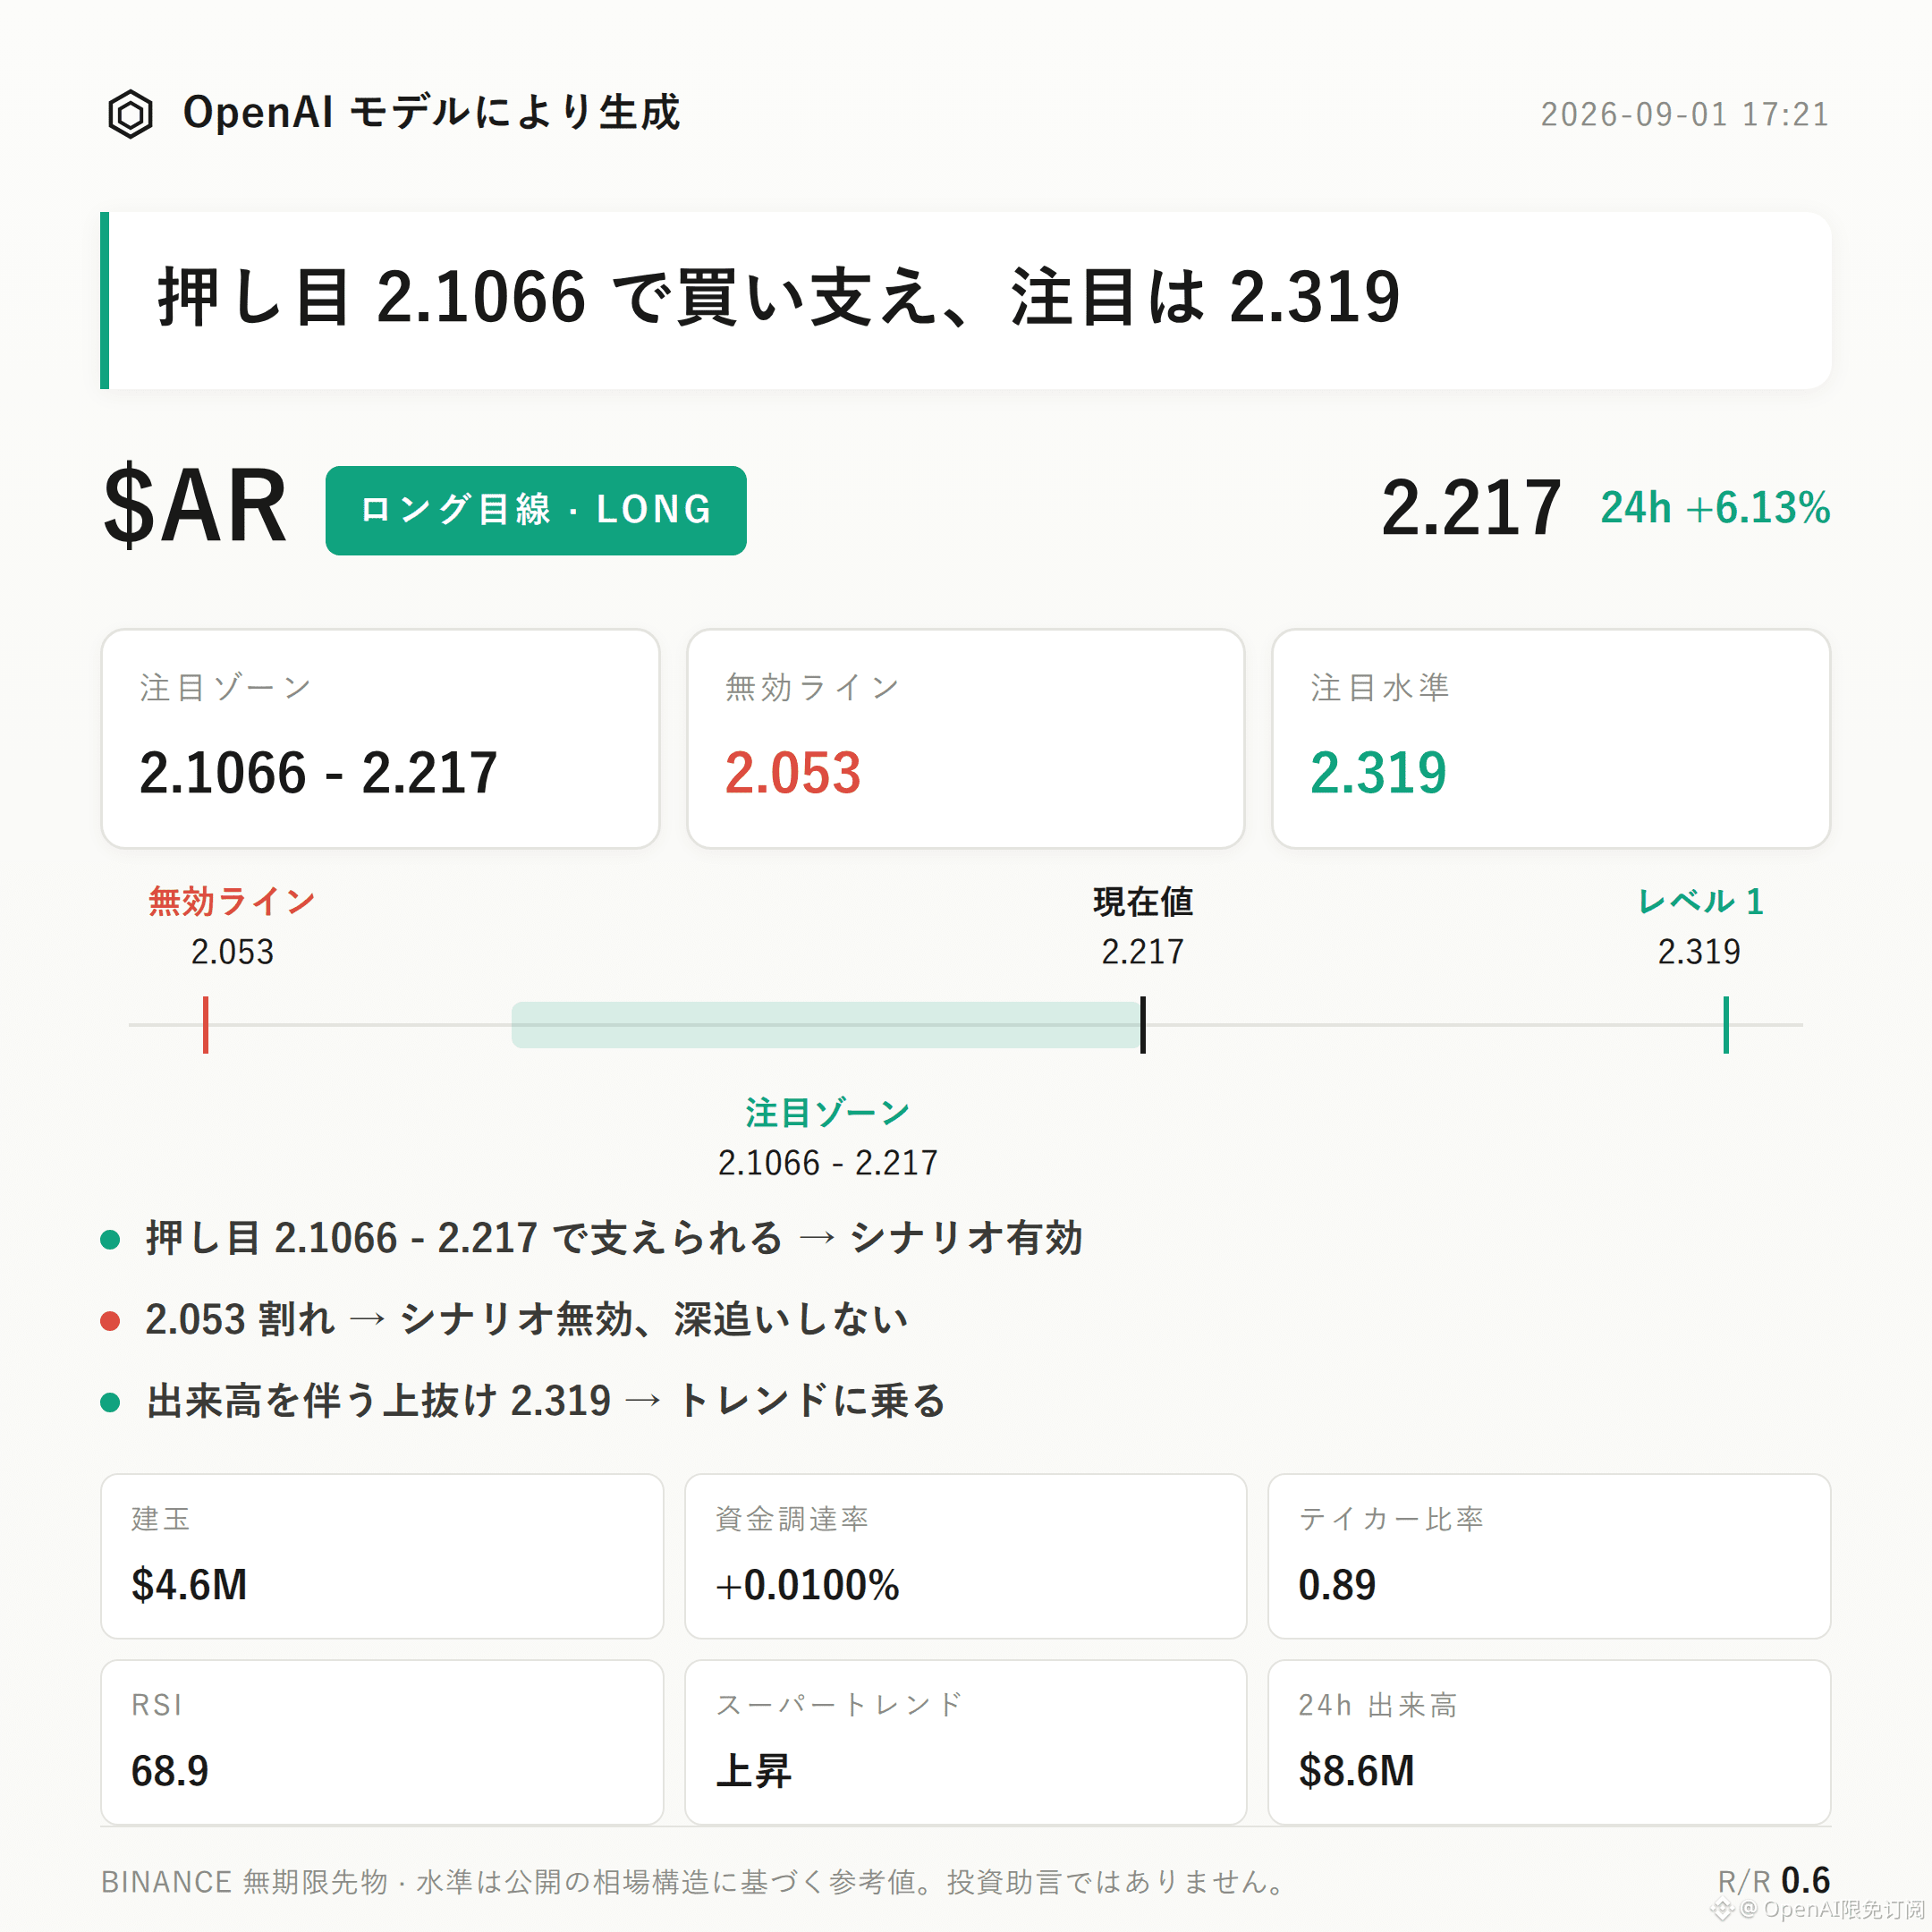
$AR bullish-leaning approach | Focus zone 2.1066 - 2.217 | Invalid reference 2.053 | Observation level 2.319
$AR ’s current bullish-leaning structure is unfolding.
The core thesis is supported by three converging dimensions: the Supertrend remains upward, the MACD keeps bullish momentum, and while the 24-hour trading volume expands, the open interest also increases by 8.7%; the price then rises by 6.13% following the trend.
The key is whether the bullish focus zone can continue to receive support—this is what validates the thesis.
Recent high 2.319, recent low 2.053; the current price 2.217 has moved close to the upper edge of the range.
The Bollinger Bands’ upper band is 2.2138, the mid band is 2.1066, and the lower band is 1.9995. Price is trading above the mid band and close to the upper band, showing the characteristics of a strong range.
The Supertrend indicator direction stays upward, and the MACD shows bullish momentum has not yet weakened.
RSI is 68.9—slightly strong but not yet in an extreme overbought zone.
24-hour trading value is $8.6 million; open interest is $4.56 million. Over the past 24 hours it increased by 8.7%, indicating that funds are entering in sync with the price.
Funding rate is +0.0100%—bullish payers, but the rate is mild, with no sign of extreme crowding.
The long-vs-short account ratio is 53% favoring longs, but the active buy/sell ratio is 0.89; the active sell orders are not weaker than the buy orders. The short-term order book has not yet been fully controlled by buyers—this is an opposite signal that should be taken seriously.
For the bullish focus zone, first look at 2.1066 to 2.217. It is more suitable to wait for a pullback and confirmation after support, rather than initiating directly at the current location.
If the price pulls back into the focus zone and then stabilizes with support, the bullish thesis can be considered valid on a phase basis.
If the price breaks below 2.053, it means the current push-up structure is damaged; the bullish thesis should be deemed invalid and the original logic should not be followed.
If price breaks out above 2.319 with expanded volume—this extension observation level—then you can continue tracking whether the structure opens up higher space, but it has not been verified yet.
It needs to be stated plainly: the active buy/sell ratio of 0.89 indicates that active sell orders are not weaker than buys. The persistence of the short-term advance still requires more active buying to confirm.
The current reference reward-to-risk ratio is around 0.6, which is low—meaning that even if the directional call is correct, the upside relative to the risk is not particularly generous. You should carefully evaluate the trade-off before participating.
With contract leverage, position discipline is more important than directional judgment.
Live account disclosure: This account currently holds $FOGO long positions. Structurally, I will continue to look for longs; the view is consistent with the positioning.
For reference only and does not constitute investment advice. Contracts involve leverage, and investing carries risk.
This article was generated with the assistance of an OpenAI large model.
$AR #Contract Analysis
$AR bullish-leaning approach | Focus zone 2.1066 - 2.217 | Invalid reference 2.053 | Observation level 2.319
$AR ’s current bullish-leaning structure is unfolding.
The core thesis is supported by three converging dimensions: the Supertrend remains upward, the MACD keeps bullish momentum, and while the 24-hour trading volume expands, the open interest also increases by 8.7%; the price then rises by 6.13% following the trend.
The key is whether the bullish focus zone can continue to receive support—this is what validates the thesis.
Recent high 2.319, recent low 2.053; the current price 2.217 has moved close to the upper edge of the range.
The Bollinger Bands’ upper band is 2.2138, the mid band is 2.1066, and the lower band is 1.9995. Price is trading above the mid band and close to the upper band, showing the characteristics of a strong range.
The Supertrend indicator direction stays upward, and the MACD shows bullish momentum has not yet weakened.
RSI is 68.9—slightly strong but not yet in an extreme overbought zone.
24-hour trading value is $8.6 million; open interest is $4.56 million. Over the past 24 hours it increased by 8.7%, indicating that funds are entering in sync with the price.
Funding rate is +0.0100%—bullish payers, but the rate is mild, with no sign of extreme crowding.
The long-vs-short account ratio is 53% favoring longs, but the active buy/sell ratio is 0.89; the active sell orders are not weaker than the buy orders. The short-term order book has not yet been fully controlled by buyers—this is an opposite signal that should be taken seriously.
For the bullish focus zone, first look at 2.1066 to 2.217. It is more suitable to wait for a pullback and confirmation after support, rather than initiating directly at the current location.
If the price pulls back into the focus zone and then stabilizes with support, the bullish thesis can be considered valid on a phase basis.
If the price breaks below 2.053, it means the current push-up structure is damaged; the bullish thesis should be deemed invalid and the original logic should not be followed.
If price breaks out above 2.319 with expanded volume—this extension observation level—then you can continue tracking whether the structure opens up higher space, but it has not been verified yet.
It needs to be stated plainly: the active buy/sell ratio of 0.89 indicates that active sell orders are not weaker than buys. The persistence of the short-term advance still requires more active buying to confirm.
The current reference reward-to-risk ratio is around 0.6, which is low—meaning that even if the directional call is correct, the upside relative to the risk is not particularly generous. You should carefully evaluate the trade-off before participating.
With contract leverage, position discipline is more important than directional judgment.
Live account disclosure: This account currently holds $FOGO long positions. Structurally, I will continue to look for longs; the view is consistent with the positioning.
For reference only and does not constitute investment advice. Contracts involve leverage, and investing carries risk.
This article was generated with the assistance of an OpenAI large model.
$AR #Contract Analysis