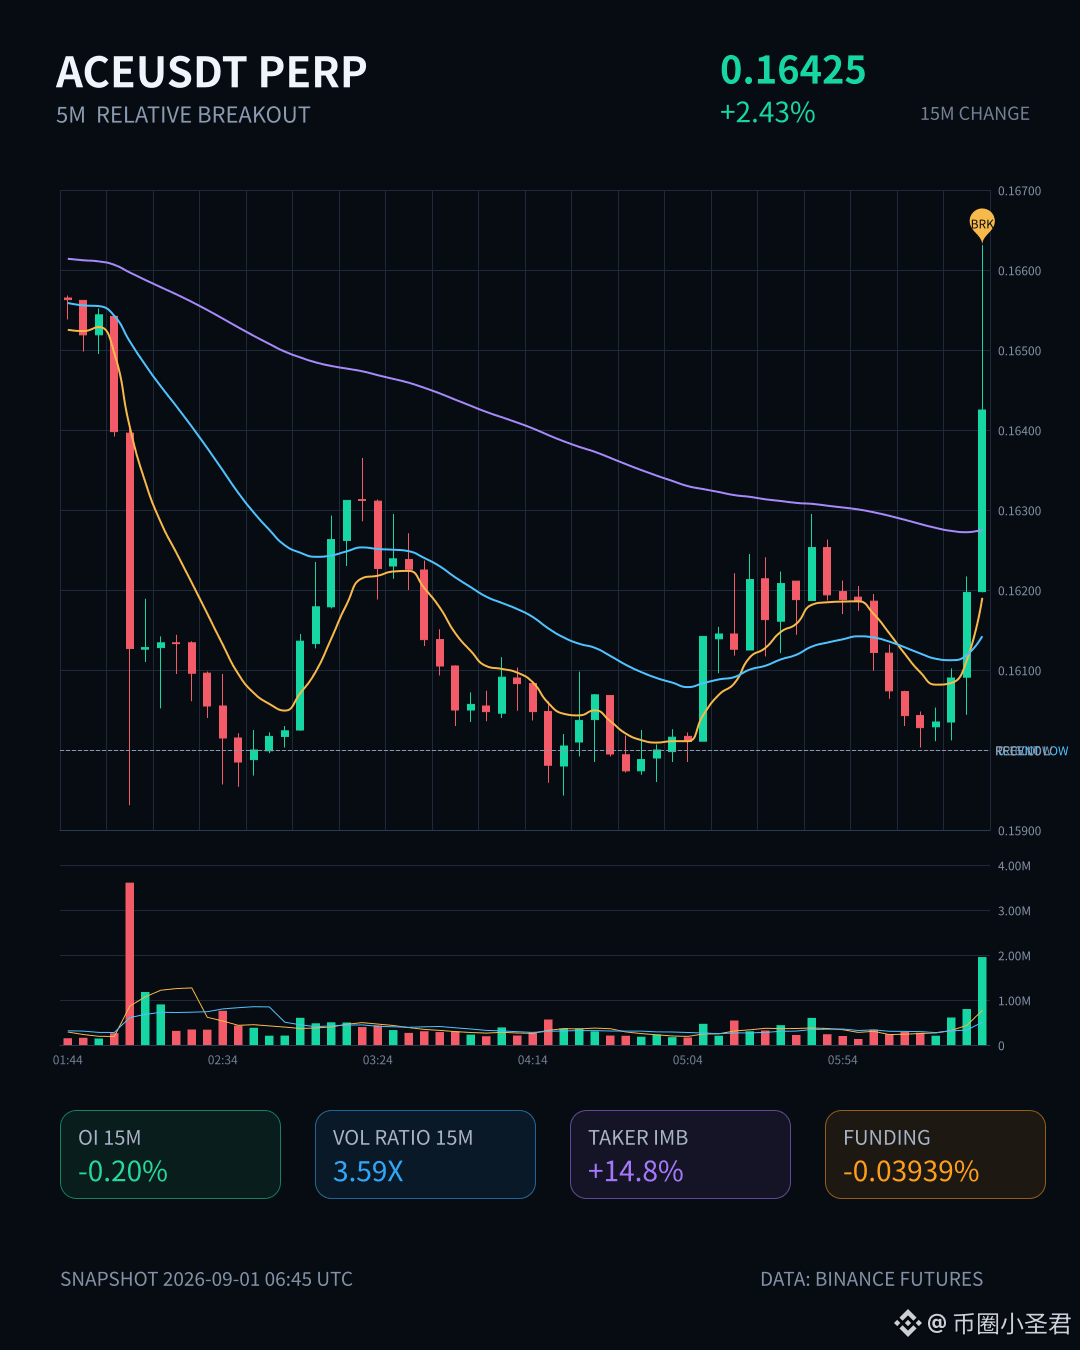
$ACE This wave surged 2.43% in just 15 minutes. Trading volume directly jumped to nearly 3.6 times, and even at the close it stubbornly pushed through the upper boundary of the most recent 20 five-minute K-lines. On the surface, it looks like a breakout—but OI is actually only slightly down.
In plain terms, this doesn’t look like new money rushing in to chase the move. It’s more like the shorts are concentrating on covering, and the price action looks like positions getting squeezed out. The aggressive order imbalance widened to 14.8%, and buy-side participation is definitely absorbing orders—but combined with the OI decline structure, you should still stay alert.
At this point, ACE is approaching its own historical extreme zone. The entire pool’s abnormal percentile is 99.2%, meaning it’s one of the few assets currently being watched by capital. Short-term sentiment is indeed strong, but a breakout with no follow-through on volume is one thing—whether it can hold its ground afterward is another.
In plain terms, this doesn’t look like new money rushing in to chase the move. It’s more like the shorts are concentrating on covering, and the price action looks like positions getting squeezed out. The aggressive order imbalance widened to 14.8%, and buy-side participation is definitely absorbing orders—but combined with the OI decline structure, you should still stay alert.
At this point, ACE is approaching its own historical extreme zone. The entire pool’s abnormal percentile is 99.2%, meaning it’s one of the few assets currently being watched by capital. Short-term sentiment is indeed strong, but a breakout with no follow-through on volume is one thing—whether it can hold its ground afterward is another.