NVDA launches three coins in sync, multi-cycle resonance, 30-min and 4-hour simultaneous golden cross with volume surge 🔥
════════════════════
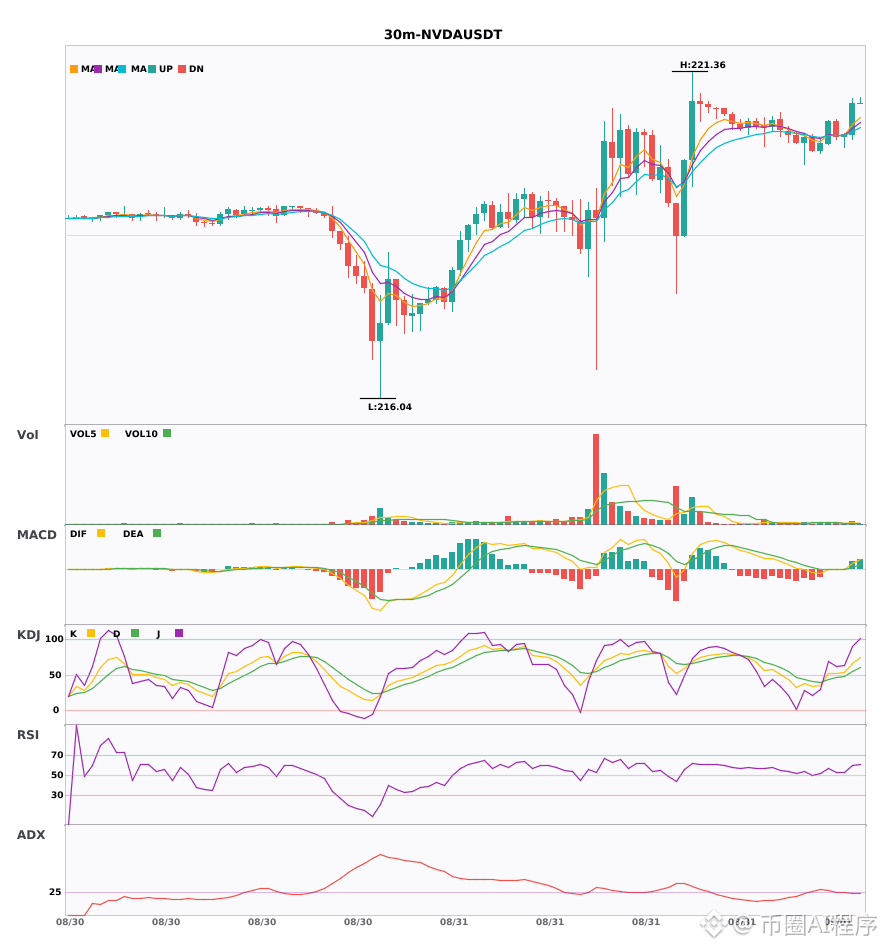
🔴 $NVDA 30 minutes Bullish signal
⚠️ Technical analysis: The 4-hour trend is bullish as a foundation, and the 30-minute timeframe is also catching up. The MACD just formed a golden cross above zero, the red histogram is starting to expand, and the moving averages are arranged in a bullish order, spreading upward. After the KDJ golden cross, it’s still moving up without entering the overbought zone, and volume has also expanded by about 2x. The multi-cycle resonance signal is in play—keep an eye on it.
════════════════════
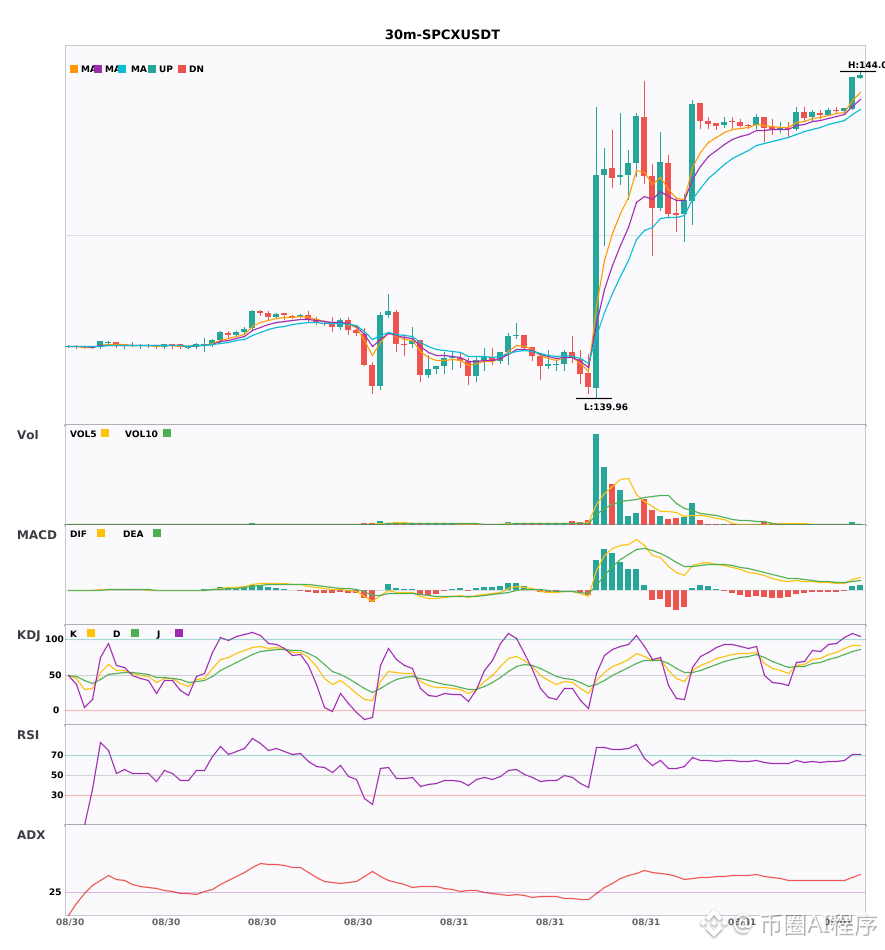
🔴 $SPCX 30 minutes Bullish signal
⚠️ Technical analysis: The 4-hour big direction confirms bullishness. On the 30-minute chart, the MACD has just formed a golden cross above zero, the red histogram is beginning to expand, the moving-average bullish alignment has just formed, and the KDJ has already jumped into the overbought zone—be cautious. Volume is up 2.7x, very strong.
════════════════════
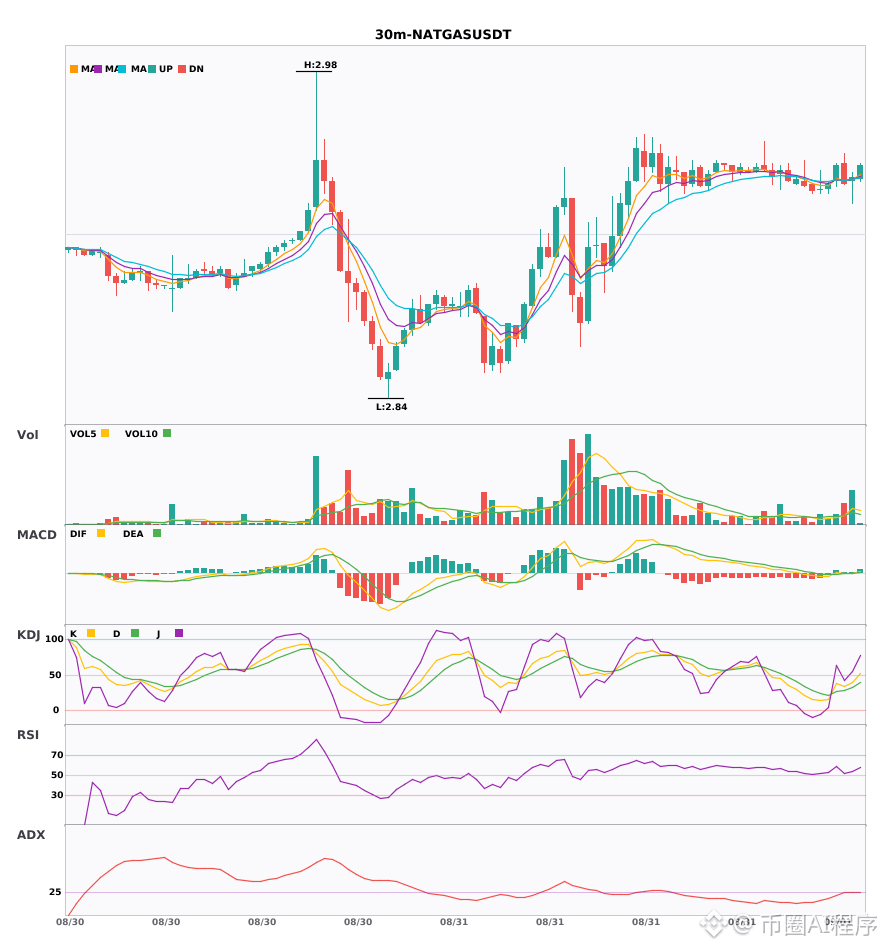
🔴 $NATGAS 30 minutes Bullish signal
⚠️ Technical analysis: Both the 4-hour and 30-minute charts look bullish. The MACD just turned red and produced a red histogram, and the 5/8 moving-average golden cross is forming. The near term is likely to rise, but the KDJ hasn’t caught up yet—slightly weak.
════════════════════
🔔 Watch for real-time early alerts on market anomalies 🔔
#多周期共振 #NVDA #SPCX #NATGAS
📌 When trading, pay attention to whether the candlestick patterns match
════════════════════
🔴 $NVDA 30 minutes Bullish signal
⚠️ Technical analysis: The 4-hour trend is bullish as a foundation, and the 30-minute timeframe is also catching up. The MACD just formed a golden cross above zero, the red histogram is starting to expand, and the moving averages are arranged in a bullish order, spreading upward. After the KDJ golden cross, it’s still moving up without entering the overbought zone, and volume has also expanded by about 2x. The multi-cycle resonance signal is in play—keep an eye on it.
════════════════════
🔴 $SPCX 30 minutes Bullish signal
⚠️ Technical analysis: The 4-hour big direction confirms bullishness. On the 30-minute chart, the MACD has just formed a golden cross above zero, the red histogram is beginning to expand, the moving-average bullish alignment has just formed, and the KDJ has already jumped into the overbought zone—be cautious. Volume is up 2.7x, very strong.
════════════════════
🔴 $NATGAS 30 minutes Bullish signal
⚠️ Technical analysis: Both the 4-hour and 30-minute charts look bullish. The MACD just turned red and produced a red histogram, and the 5/8 moving-average golden cross is forming. The near term is likely to rise, but the KDJ hasn’t caught up yet—slightly weak.
════════════════════
🔔 Watch for real-time early alerts on market anomalies 🔔
#多周期共振 #NVDA #SPCX #NATGAS
📌 When trading, pay attention to whether the candlestick patterns match