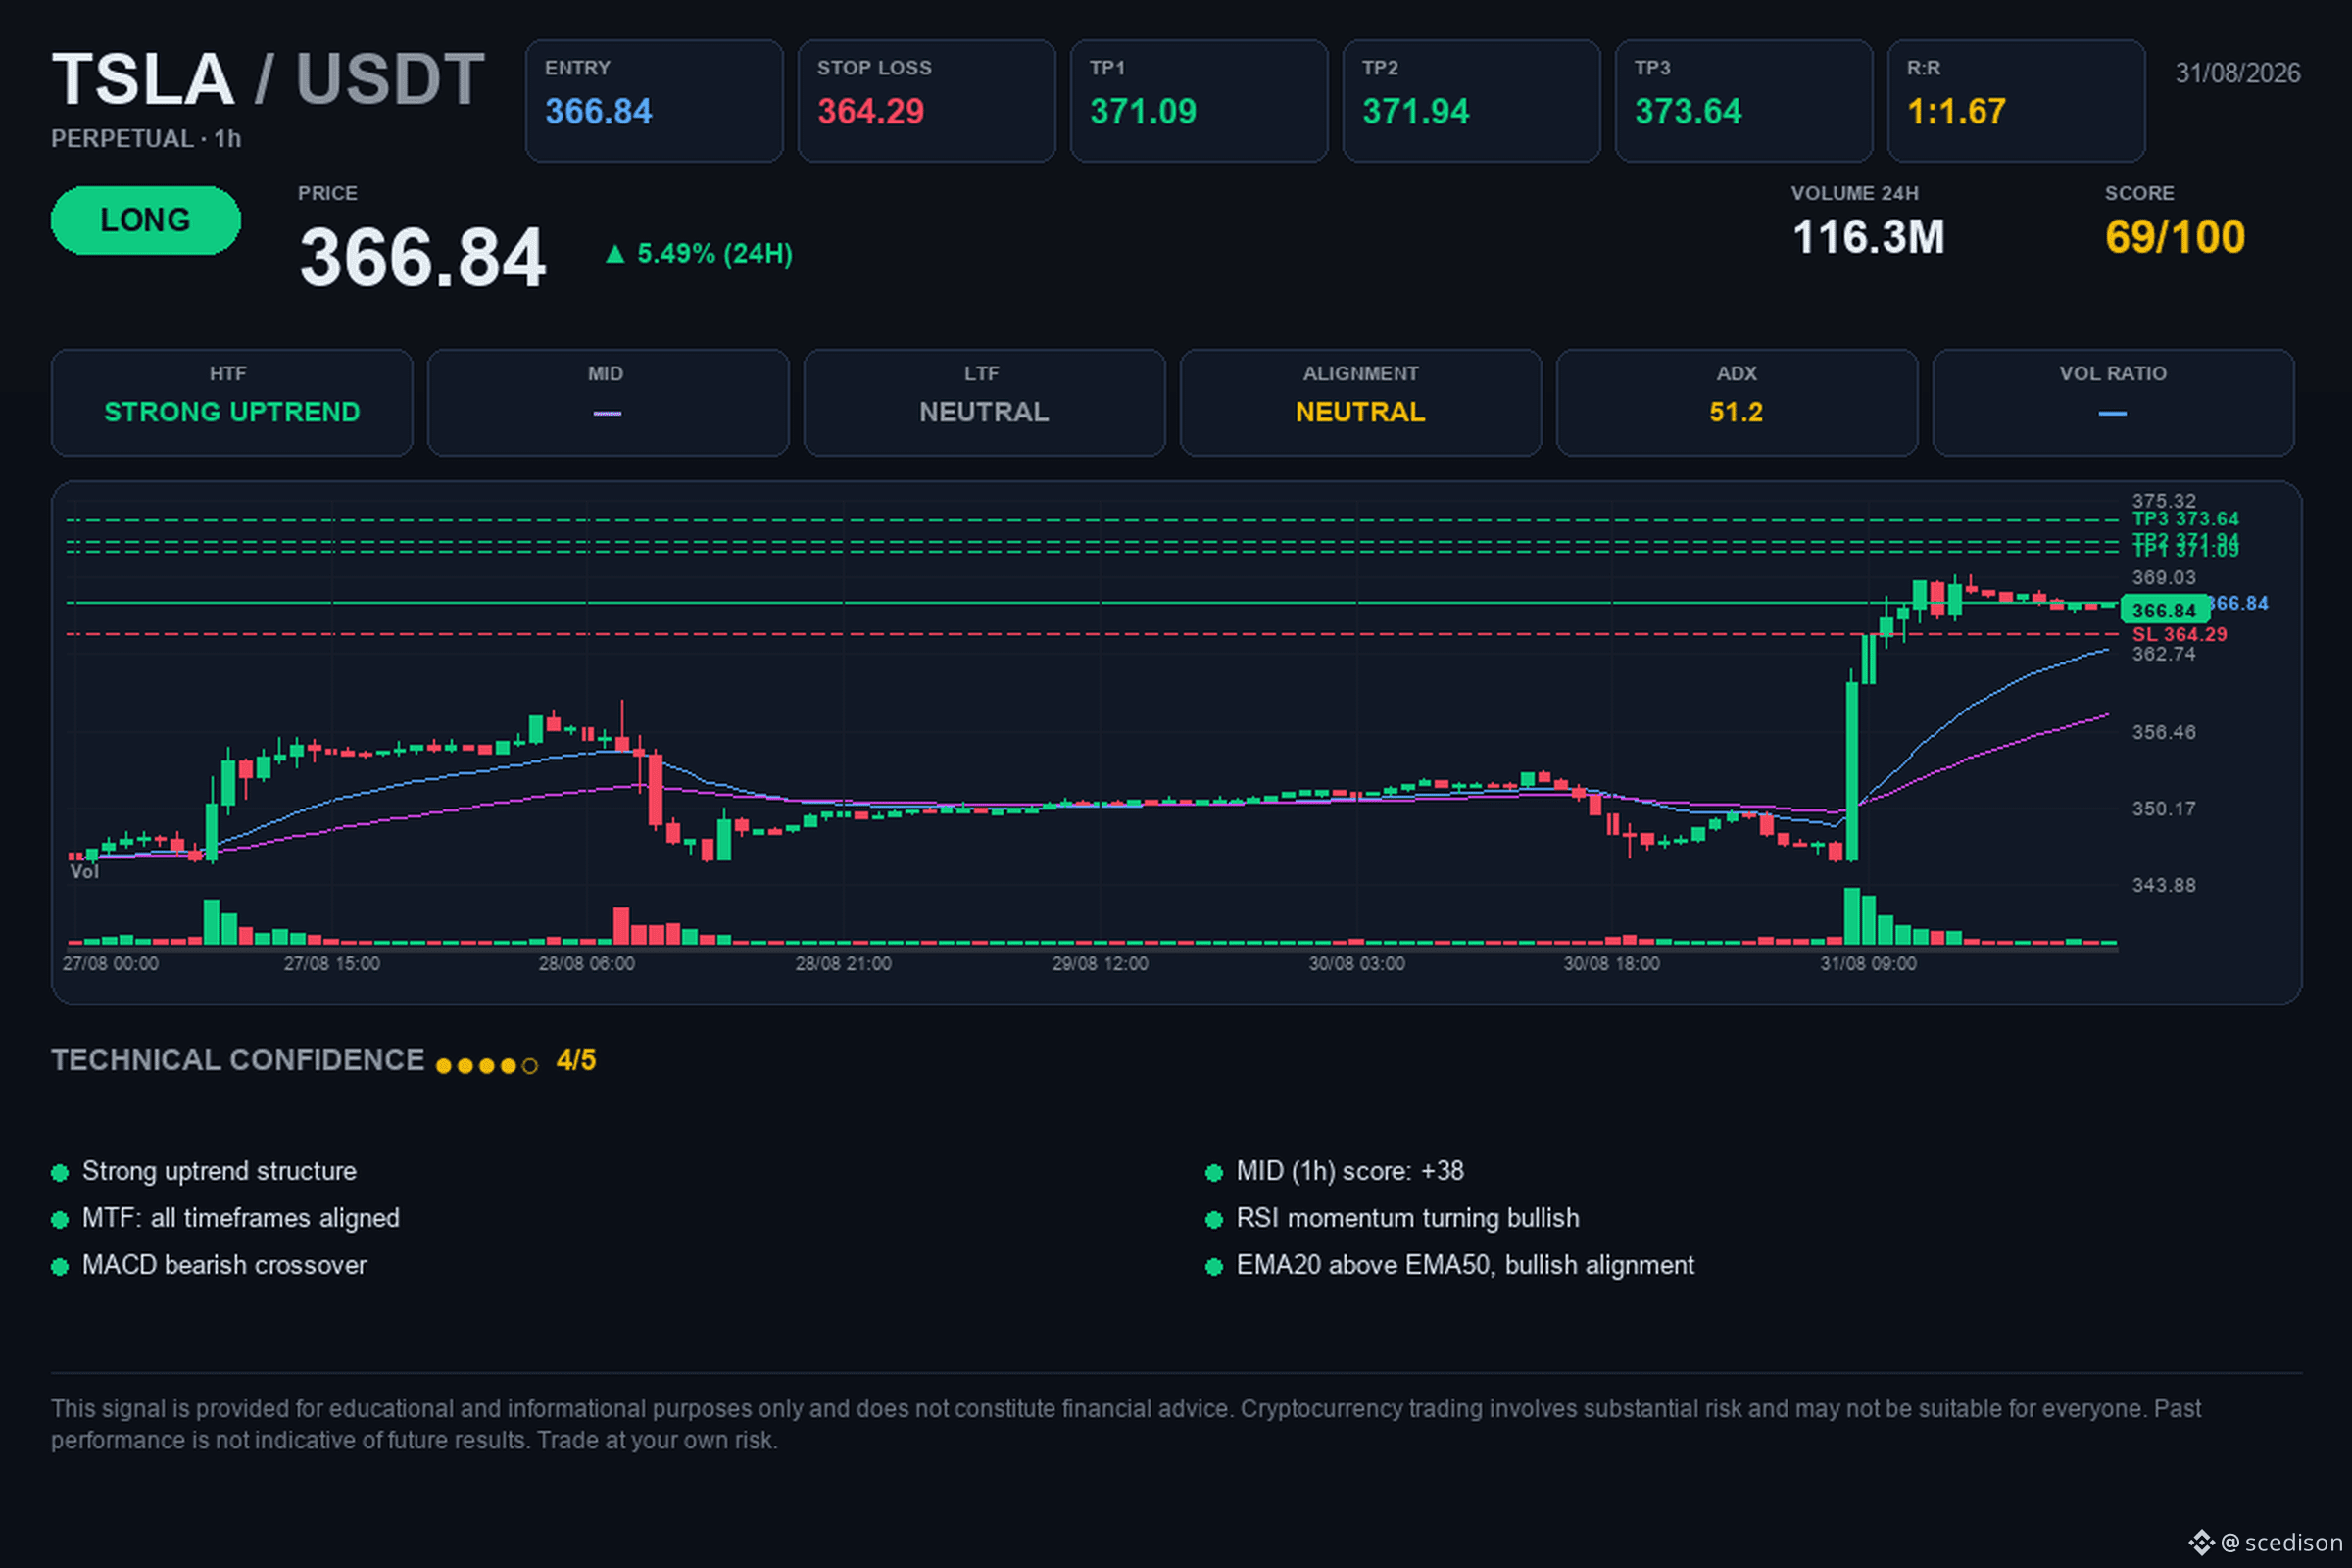
📢 $TSLA / $USDT | 🟢 LONG | ⭐ 69.4%
🎯 Target: $371.09. Will it hit?
🎯 Trading levels:
🟢 Entry: $366.84
🛑 Stop Loss: $364.29
🏁 TP1: $371.09
🏁 TP2: $371.94
🏁 TP3: $373.64
📈 Analysis:
The structure of $TSLA maintains a bullish alignment across all timeframes, confirmed by a triple-bottom pattern that consolidates the base over the EMA20. The ADX at 51.16 shows a high-intensity uptrend, while the RSI at 69.65 stays in a buyer-impulse zone without yet entering extreme overbought territory. Although the MACD histogram shows a slight contraction, the EMA hierarchy (20 > 50 > 200) supports the continuation of the bullish move.
⚖️ Risk/Reward: 1:1.67
⏱️ Timeframe: 1H
📐 Technical confidence: 4/5
The invalidation level is strictly set below the $364.29 support, the area where the bullish structure would lose strength. The thesis is validated by the sustained break of the immediate resistance at $368.93, closely monitoring buy volume to confirm the breakout of the current range.
Do you think the current momentum of $TSLA is enough to break above the $368.93 resistance in the coming hours?
💡 This analysis is educational and not financial advice. Do your own research and decide calmly.
#crypto #TSLA #trading #Futures #Bullish
🎯 Target: $371.09. Will it hit?
🎯 Trading levels:
🟢 Entry: $366.84
🛑 Stop Loss: $364.29
🏁 TP1: $371.09
🏁 TP2: $371.94
🏁 TP3: $373.64
📈 Analysis:
The structure of $TSLA maintains a bullish alignment across all timeframes, confirmed by a triple-bottom pattern that consolidates the base over the EMA20. The ADX at 51.16 shows a high-intensity uptrend, while the RSI at 69.65 stays in a buyer-impulse zone without yet entering extreme overbought territory. Although the MACD histogram shows a slight contraction, the EMA hierarchy (20 > 50 > 200) supports the continuation of the bullish move.
⚖️ Risk/Reward: 1:1.67
⏱️ Timeframe: 1H
📐 Technical confidence: 4/5
The invalidation level is strictly set below the $364.29 support, the area where the bullish structure would lose strength. The thesis is validated by the sustained break of the immediate resistance at $368.93, closely monitoring buy volume to confirm the breakout of the current range.
Do you think the current momentum of $TSLA is enough to break above the $368.93 resistance in the coming hours?
💡 This analysis is educational and not financial advice. Do your own research and decide calmly.
#crypto #TSLA #trading #Futures #Bullish