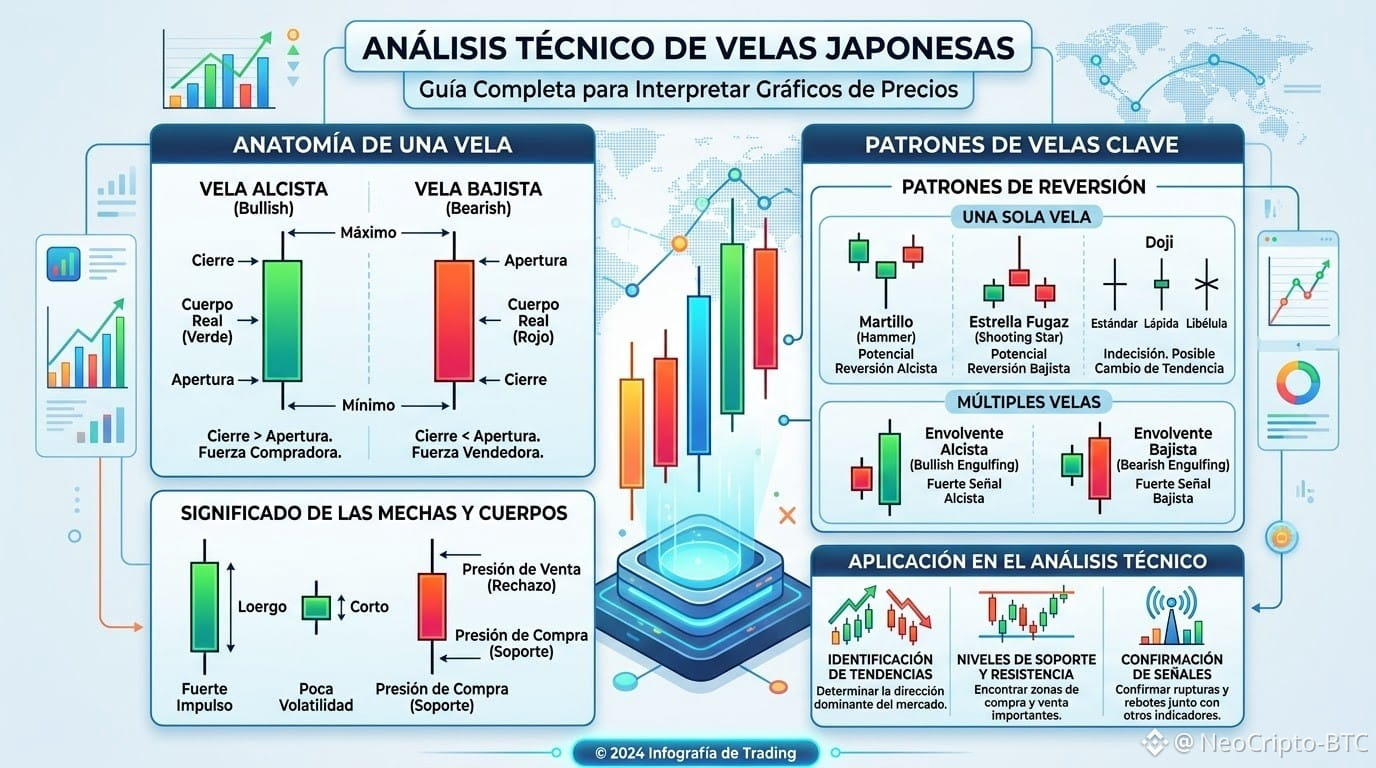
If you don’t know how to read candlesticks, you’re trading blind. Each candle tells an exact story about who controls the market: buyers or sellers.
Here’s the ultimate guide to understand them at a glance:
1. Anatomy (The basics you must master)
Green Body (Bullish): The closing price was higher than the opening. Buyers in control.
Red Body (Bearish): The closing price was below the opening. Sellers in control.
Wicks (Shadows): Show the highest and lowest point the price reached. They are battle marks between supply and demand.
2. The Language of the Body and the Wicks
Long body: Strong momentum and a clear direction.
Small body: Low volatility or a pause in the trend.
Long lower wick: Buying pressure. The market tried to drop, but buyers stepped in strongly to defend the zone.
Long upper wick: Selling pressure. Clear rejection at higher prices.
3. Key Reversal Patterns
Single candle:
Hammer: Appears at the end of a decline. Signals a possible bullish rebound.
Shooting Star: Appears after an uptrend. Signals possible exhaustion and a drop.
Doji: Opening and closing are almost the same. Total indecision in the market.
Multiple candles:
Bullish / Bearish Engulfing: A new candle whose strength "covers" completely the body of the previous candle. It’s one of the most powerful signals of trend change.
💡 The Golden Rule
One single candle is not enough to take an entry. Always combine these patterns with support/resistance zones, volume, or trend confirmation.
📌 Save this post to keep your visual cheat sheet on hand before your next trading session, and share it with someone who’s just starting out in the markets.
#trading
$BTC
$ETH
$BNB
Here’s the ultimate guide to understand them at a glance:
1. Anatomy (The basics you must master)
Green Body (Bullish): The closing price was higher than the opening. Buyers in control.
Red Body (Bearish): The closing price was below the opening. Sellers in control.
Wicks (Shadows): Show the highest and lowest point the price reached. They are battle marks between supply and demand.
2. The Language of the Body and the Wicks
Long body: Strong momentum and a clear direction.
Small body: Low volatility or a pause in the trend.
Long lower wick: Buying pressure. The market tried to drop, but buyers stepped in strongly to defend the zone.
Long upper wick: Selling pressure. Clear rejection at higher prices.
3. Key Reversal Patterns
Single candle:
Hammer: Appears at the end of a decline. Signals a possible bullish rebound.
Shooting Star: Appears after an uptrend. Signals possible exhaustion and a drop.
Doji: Opening and closing are almost the same. Total indecision in the market.
Multiple candles:
Bullish / Bearish Engulfing: A new candle whose strength "covers" completely the body of the previous candle. It’s one of the most powerful signals of trend change.
💡 The Golden Rule
One single candle is not enough to take an entry. Always combine these patterns with support/resistance zones, volume, or trend confirmation.
📌 Save this post to keep your visual cheat sheet on hand before your next trading session, and share it with someone who’s just starting out in the markets.
#trading
$BTC
$ETH
$BNB