$BTC / USDT: Consolidation within the range between key levels
Bitcoin is currently trading around $78,436, moving sideways within a defined range after testing the higher zones on the 1D, 4h, and 1h timeframes.
Prices and level locations:
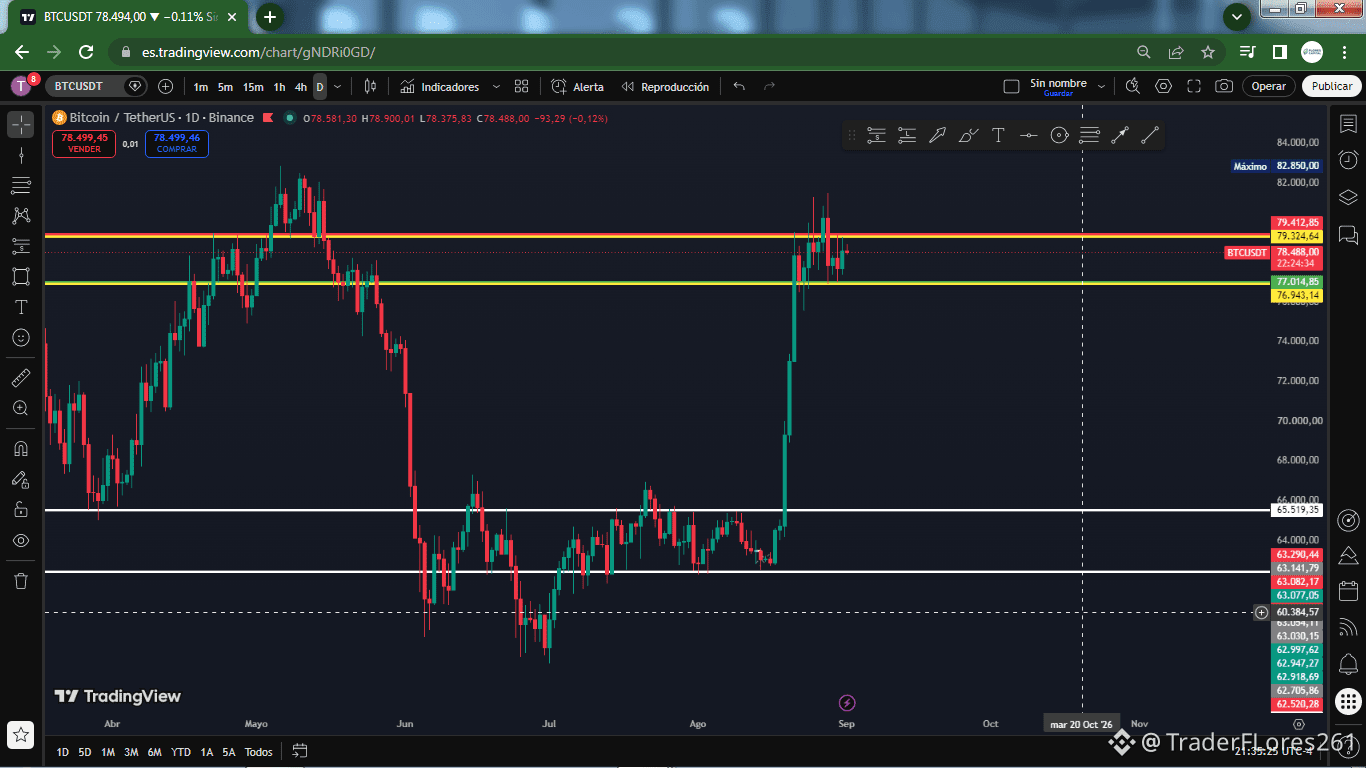
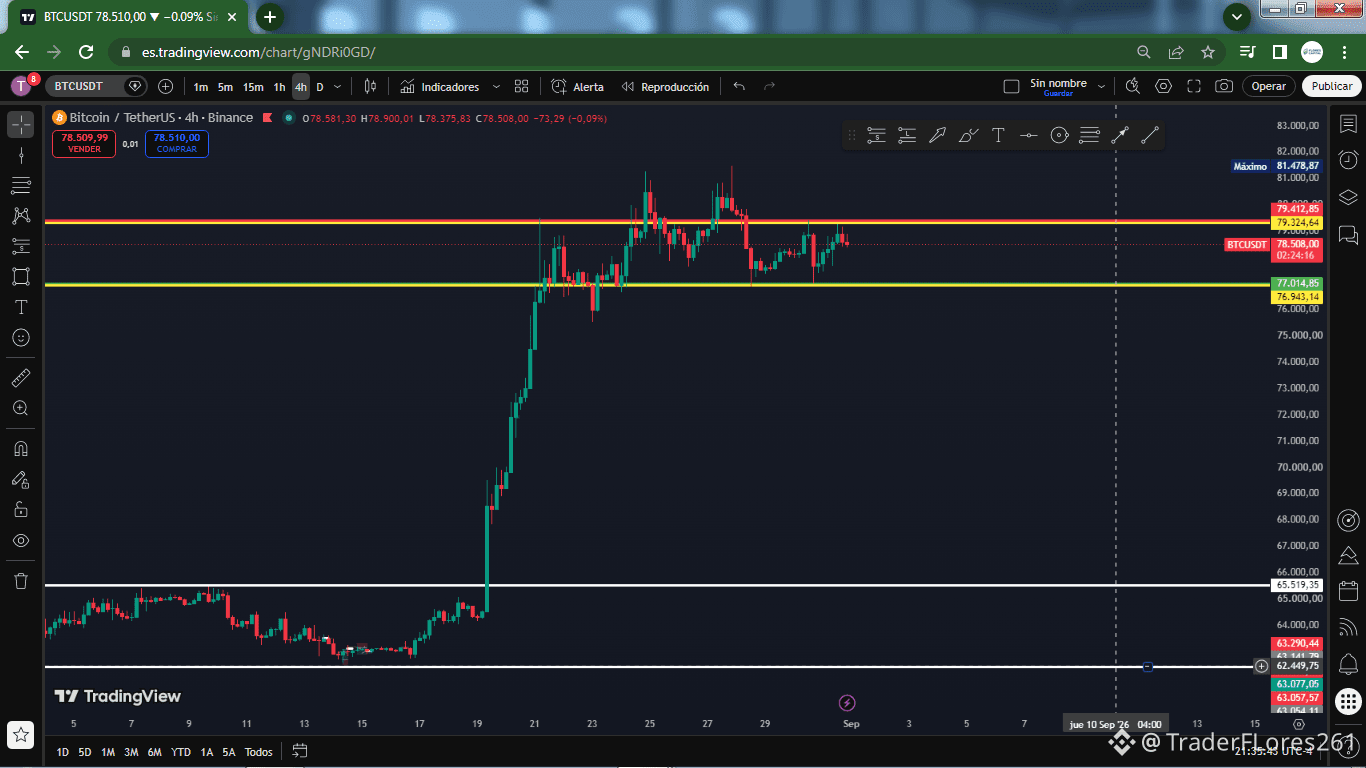
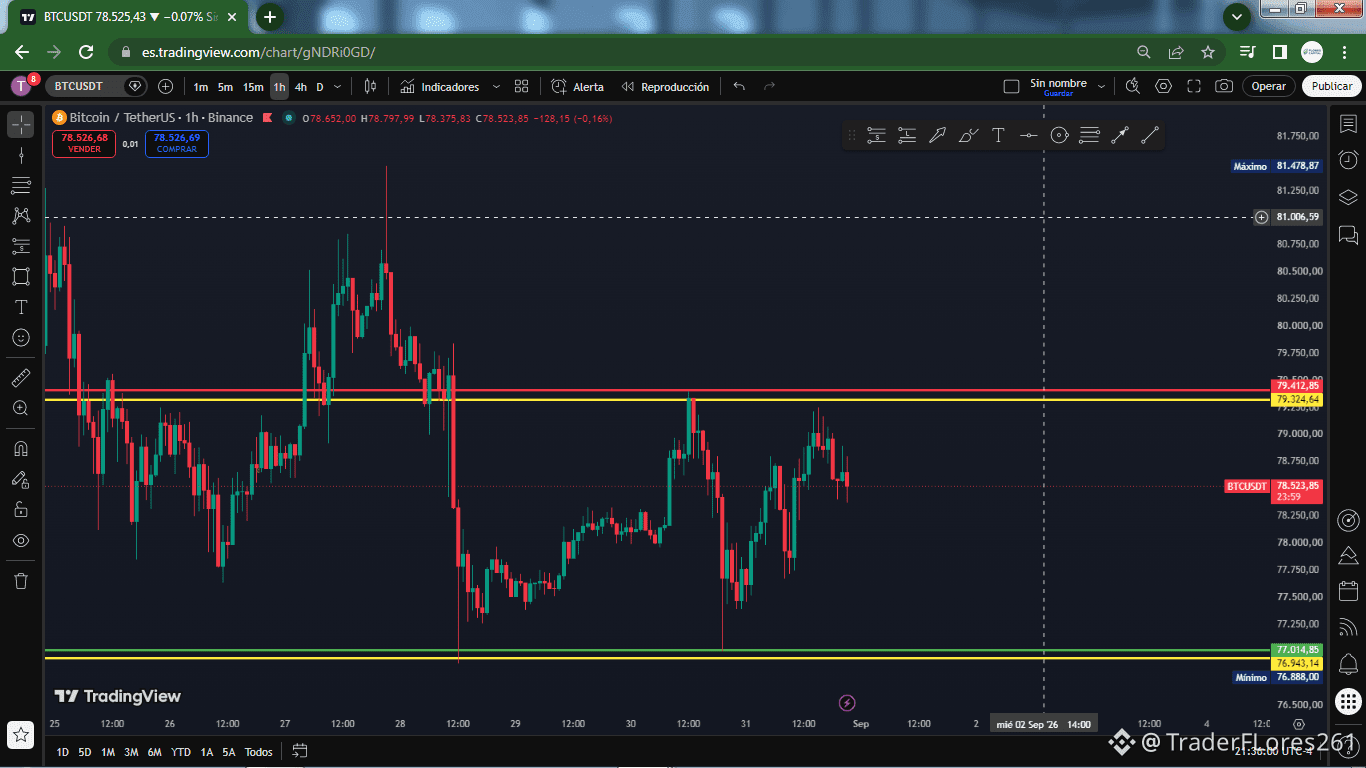
Upper Zone (Higher Prices): $79,412.85 (higher price) and $79,324.64 (lower price). This corresponds to the current ceiling range where price has met rejection on the 1h, 4h, and daily timeframes.
Lower Zone (Lower Prices): $77,014.85 (higher price) and $76,943.14 (lower price). This corresponds to the floor area where price has reacted upward on the 1h, 4h, and daily timeframes.
What is the price doing right now?
On the daily, 4-hour, and 1-hour charts, BTC is oscillating in a compressed manner between the upper band ($79,324.64 – $79,412.85) and the lower band ($76,943.14 – $77,014.85).
The asset remains trading at the center of this consolidation, accumulating volume between both price ranges.
How are you planning your trade?
If BTC manages to break out of this compression zone above $79,412.85 or seeks to retest support levels at $77,014.85, the structure will indicate the next direction.
Manage your risk properly and trade with discipline!
Click FOLLOW to make sure you don’t miss the best signals and real-time analysis! 📲💬
Bitcoin is currently trading around $78,436, moving sideways within a defined range after testing the higher zones on the 1D, 4h, and 1h timeframes.
Prices and level locations:
Upper Zone (Higher Prices): $79,412.85 (higher price) and $79,324.64 (lower price). This corresponds to the current ceiling range where price has met rejection on the 1h, 4h, and daily timeframes.
Lower Zone (Lower Prices): $77,014.85 (higher price) and $76,943.14 (lower price). This corresponds to the floor area where price has reacted upward on the 1h, 4h, and daily timeframes.
What is the price doing right now?
On the daily, 4-hour, and 1-hour charts, BTC is oscillating in a compressed manner between the upper band ($79,324.64 – $79,412.85) and the lower band ($76,943.14 – $77,014.85).
The asset remains trading at the center of this consolidation, accumulating volume between both price ranges.
How are you planning your trade?
If BTC manages to break out of this compression zone above $79,412.85 or seeks to retest support levels at $77,014.85, the structure will indicate the next direction.
Manage your risk properly and trade with discipline!
Click FOLLOW to make sure you don’t miss the best signals and real-time analysis! 📲💬