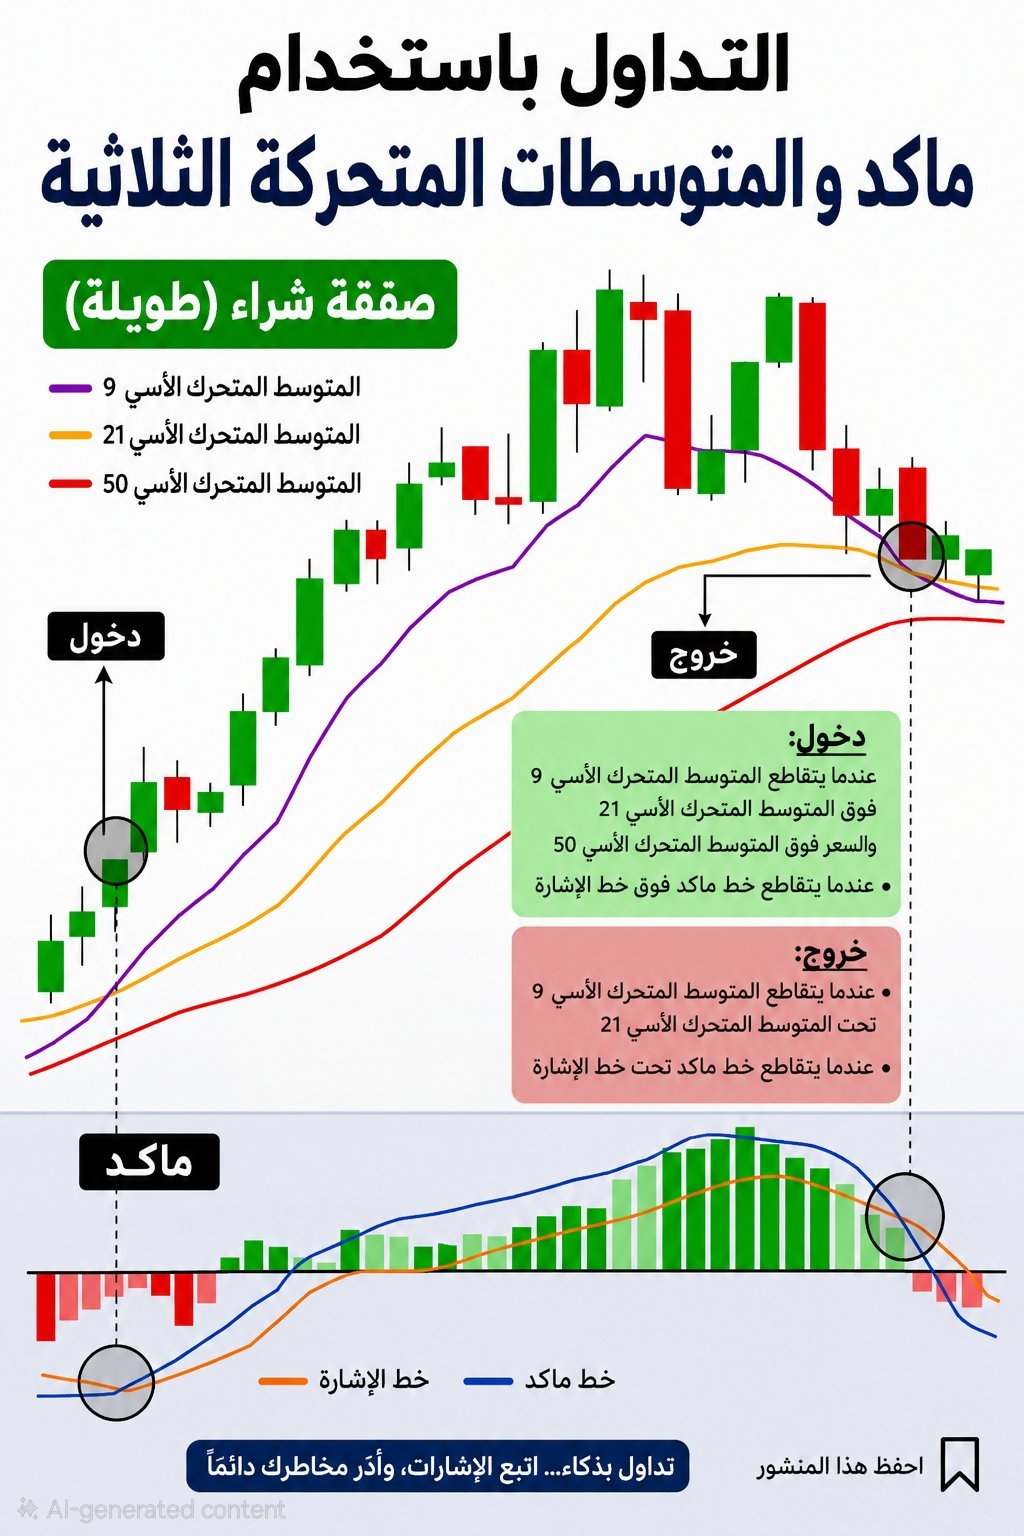
A simple strategy that combines moving averages and MACD in the world of trading. Relying on a single indicator often gives misleading signals. Therefore, this strategy uses three exponential moving averages (EMA) together with the MACD indicator to achieve clearer alignment between trend and momentum.
🔹 Used indicators:
• EMA 9 — Purple
• EMA 21 — orange
• EMA 50 — red
🟢 Buy signal:
1️⃣ EMA 9 crosses above EMA 21.
2️⃣ The price is above the EMA 50 to confirm the bullish direction.
3️⃣ The MACD line crosses above the signal line to confirm improving momentum.
When these signals agree, you get alignment between trend and momentum instead of entering just because a bullish candle appears.
🔴 As for the exit:
• EMA 9 crosses below EMA 21.
• MACD crosses the signal line to the downside.
💡 Simply:
EMA 50 = Is the overall trend bullish or bearish?
EMA 9 + EMA 21 = Has the short-term momentum started to change?
MACD = Is there additional confirmation for this momentum?
⚠️ But be careful: no strategy guarantees profit. In sideways markets, false signals may appear, so don’t ignore the stop-loss, risk management, and support and resistance.
📌 The idea isn’t to predict the future… it’s to wait until several signals align before making a decision.