

📌 TECHNICAL ANALYSIS SUMMARY REPORT FOR ETH/USDT (H1 Timeframe)
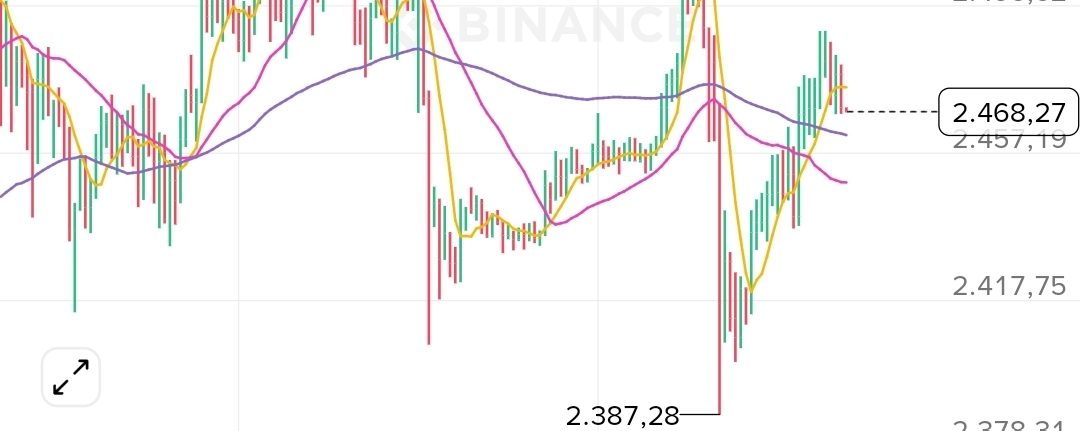
🔎 1. REVIEW OF THE U.S. SESSION (Latest Data)
• Session closing price: 2,468.14 USDT (Slight fluctuation -0.01%)
• 24h Range: High 2,489.95 USDT | Low 2,387.28 USDT
• 24h Volume: 326,699.98 ETH (~798.43M USDT)
Market sentiment:
- The U.S. session saw a very strong "liquidity sweep" (Stop-hunt) move down to the bottom area of 2,387.28 USDT.
- Immediately after that, strong dip-buying demand appeared (shown by very long lower candle wicks), pushing the price to recover and move close to the 2,470 USDT zone. This indicates that the Bulls are still defending important psychological support levels well.
Technical indicator status:
- MA system: Current price is rebounding and is stuck between the moving averages. The short-term MA(7) around 2,474.81 acts as the nearest dynamic resistance, while MA(25) at 2,449.38 and MA(99) at 2,462.05 act as support just below.
- MACD momentum: The DIF line (5.54) is above the DEA line (3.52), and the Histogram is at 2.01 (turning green), confirming that the rebound momentum after the dip is still holding well.
- Volume: The vivid orange volume bars at the bottom zone indicate extremely active bottom-fishing/accumulation capital flow.
➡️ 2. ASIAN - EUROPE TRADE DIRECTION
It’s expected that the Asian - European session will follow a rising accumulation pattern (sideway up) before testing the overhead resistance zones.
📈 SCENARIO 1: STRONG ACCUMULATION & BREAKOUT (Preferred)
• Price action: Price holds above the MA(25) and MA(99) support axis around 2,450 - 2,460 USDT, then buying power pushes price decisively above MA(7) (2,475 USDT).
• Plan (Long): Consider scaling into Buy positions around 2,455 - 2,462 USDT when a sell-side exhaustion signal appears.
• Take Profit (TP): Near resistance at 2,496 USDT, and further out the previous peak at 2,566 USDT.
• Stop Loss (SL): Absolutely below 2,435 USDT.
📉 SCENARIO 2: RECHECK BUYING POWER (Retest the bottom)
• Price action: The Sellers try to push the price down once more to test the buying strength at the old candle wick. Price breaks through the MA support cluster, pulling it deeper.
• Plan (Short): If the H1 candle closes below 2,445 USDT with large volume, you may open a short position following the correction trend.
• Take Profit (TP): A hard support zone at 2,417 USDT or the old wick-sweep zone at 2,387 USDT.
• Stop Loss (SL): Above the 2,475 USDT level.
⚠️ RISK MANAGEMENT ADVICE:
Asian sessions often have low liquidity, so prices tend to hover back and forth. Be patient and wait for the price to establish a stable base zone around the MA lines, or wait until the early European session when large capital flows in to optimize the Risk/Reward ratio. $ETH
