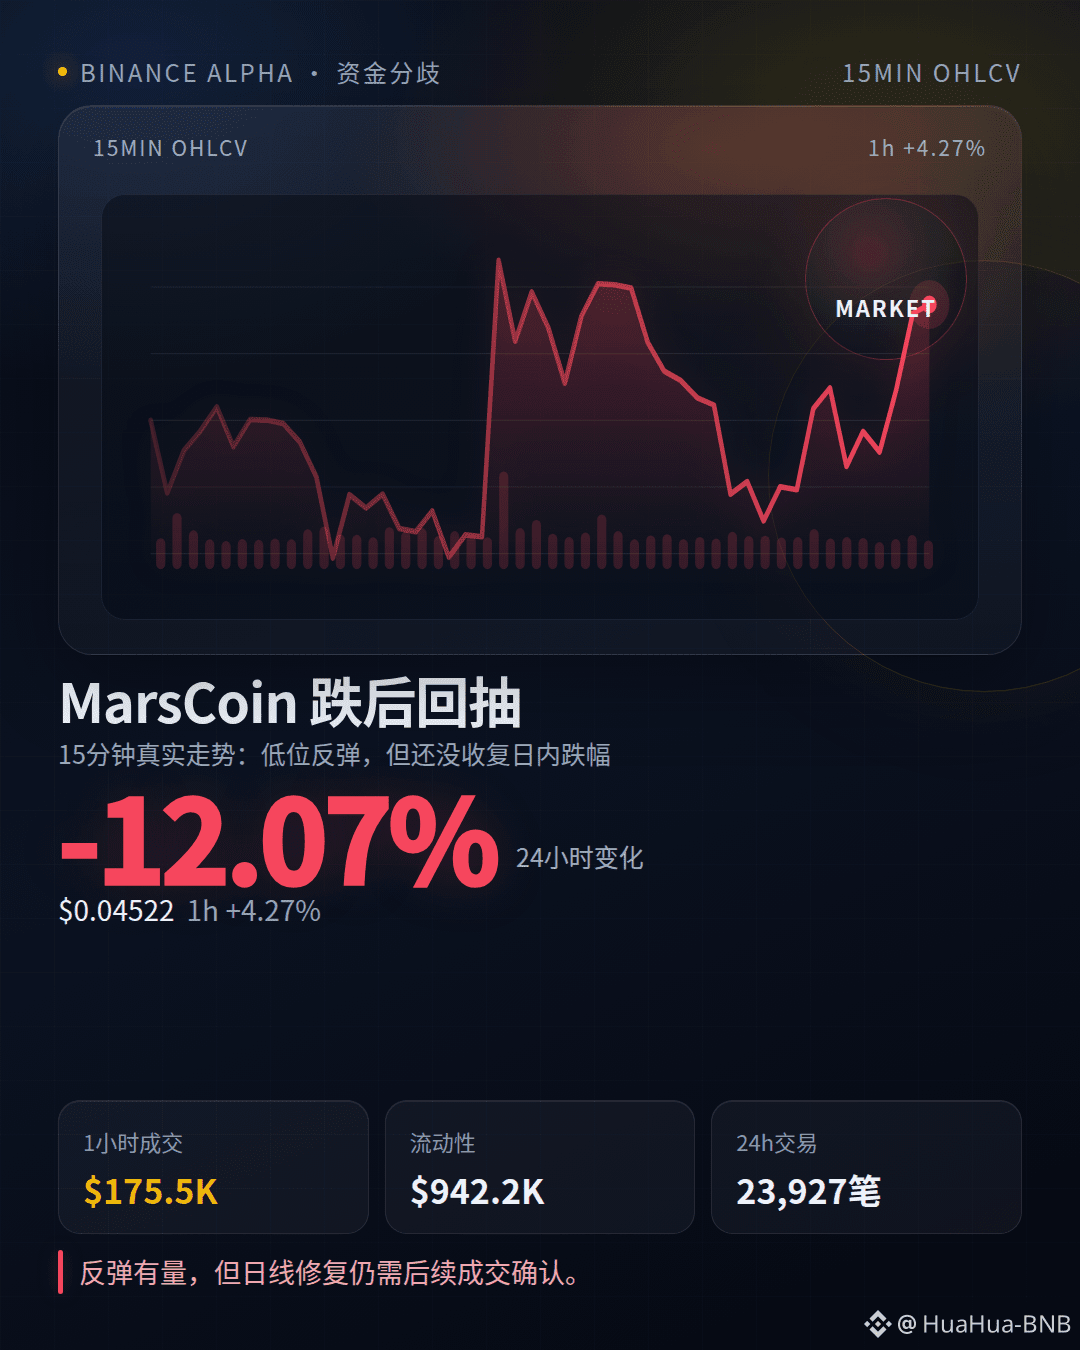

It dropped 12.07% in 24 hours, yet MarsCoin pulled back 4.27% in the most recent hour. A rebound after a sell-off is the easiest way to get people excited, but the key point in this chart is that buy and sell activity has clearly diverged.
The facts are right here: in the last hour, trading volume was about $175,500, with buys around $126,400 and sells around $49,200; current liquidity is about $942,200. In the past 24 hours, trading volume was about $9.04 million, across 23,900 trades—momentum hasn’t fully cooled off.
I’ll treat this as an example of sentiment repair on the Alpha board, not something that makes me rush to equate a one-hour rebound with a trend reversal. The intraday drop is still in place; whether the subsequent trading can sustain is what matters.
Range-bound pullbacks happen fast, and when liquidity and the news cycle shift, it’s also easy to flip. Chasing gains still carries high risk. When you see a chart that “dropped all day and then suddenly pulled back,” will you keep watching the volume, or just swipe past it?
$MarsCoin #BinanceAlpha #BSC
The facts are right here: in the last hour, trading volume was about $175,500, with buys around $126,400 and sells around $49,200; current liquidity is about $942,200. In the past 24 hours, trading volume was about $9.04 million, across 23,900 trades—momentum hasn’t fully cooled off.
I’ll treat this as an example of sentiment repair on the Alpha board, not something that makes me rush to equate a one-hour rebound with a trend reversal. The intraday drop is still in place; whether the subsequent trading can sustain is what matters.
Range-bound pullbacks happen fast, and when liquidity and the news cycle shift, it’s also easy to flip. Chasing gains still carries high risk. When you see a chart that “dropped all day and then suddenly pulled back,” will you keep watching the volume, or just swipe past it?
$MarsCoin #BinanceAlpha #BSC