📈 Update of coin $ARB
📊 Bullish Scenario (Buy):
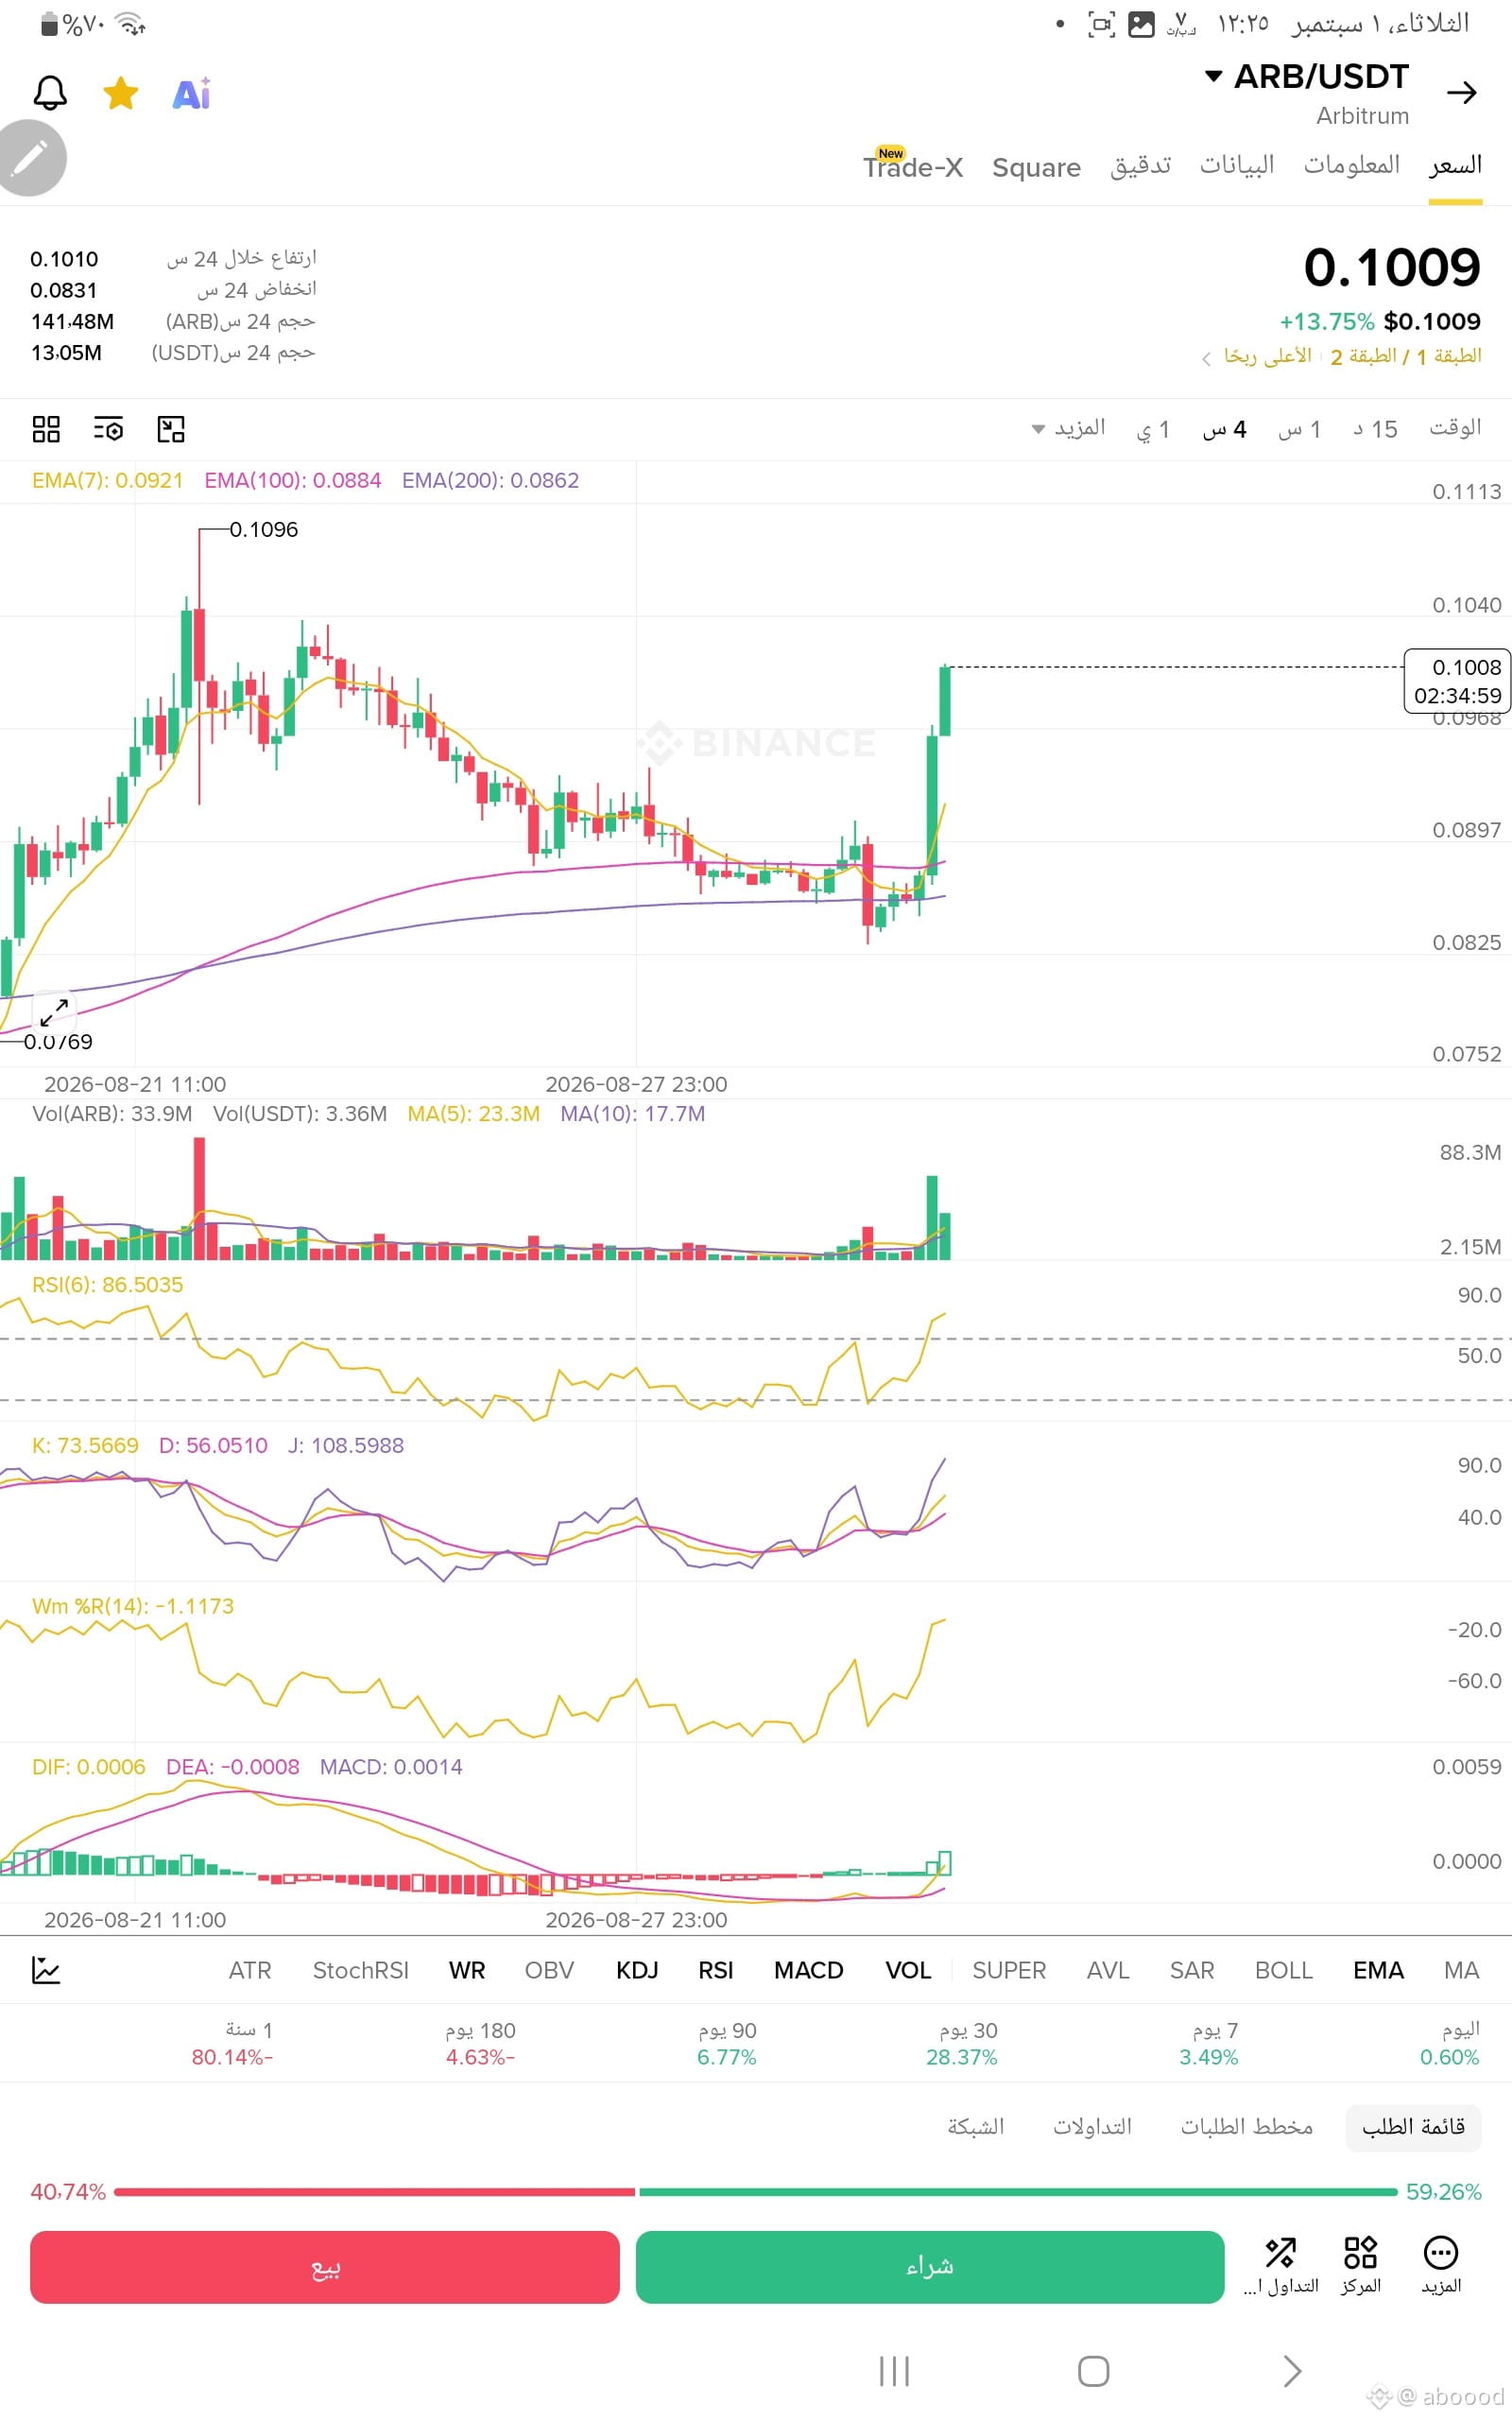
ARB shows a strong positive breakout (Pump), represented by a long green candle that pushed the price to currently trade at 0.1009 above all the main moving averages (EMA 7, 100, 200). This rally is supported by a notable increase in trading volume (Volume). The MACD indicator is approaching a positive crossover above the zero line, which strengthens buying momentum. If the price manages to hold and stabilize above the 0.1000 barrier, the next target will be to test the previous high at 0.1096.
📉 Bearish Scenario (Sell):
On the other hand, the fast indicators have surged strongly into areas of sharp overbought conditions; where the Relative Strength Index (RSI) is at very high levels of 86.50, which increases the likelihood of a sudden bearish correction due to profit-taking. If the price fails to maintain its current levels and starts to decline, the nearby support levels it would look for to consolidate are at 0.0921 (EMA 7 average), then the price range between 0.0884 and 0.0862 (EMA 100 and 200 averages).
#IranStrikesUSBasesInJordan #TankerHitsMinesInStraitOfHormuz #RussiaStartsLargeScaleDigitalRubleRolloutSep1 #BitcoinUp23%InAugustOutperformingGoldAndStocks #USCanadaTradeWarDeepens
📊 Bullish Scenario (Buy):
ARB shows a strong positive breakout (Pump), represented by a long green candle that pushed the price to currently trade at 0.1009 above all the main moving averages (EMA 7, 100, 200). This rally is supported by a notable increase in trading volume (Volume). The MACD indicator is approaching a positive crossover above the zero line, which strengthens buying momentum. If the price manages to hold and stabilize above the 0.1000 barrier, the next target will be to test the previous high at 0.1096.
📉 Bearish Scenario (Sell):
On the other hand, the fast indicators have surged strongly into areas of sharp overbought conditions; where the Relative Strength Index (RSI) is at very high levels of 86.50, which increases the likelihood of a sudden bearish correction due to profit-taking. If the price fails to maintain its current levels and starts to decline, the nearby support levels it would look for to consolidate are at 0.0921 (EMA 7 average), then the price range between 0.0884 and 0.0862 (EMA 100 and 200 averages).
#IranStrikesUSBasesInJordan #TankerHitsMinesInStraitOfHormuz #RussiaStartsLargeScaleDigitalRubleRolloutSep1 #BitcoinUp23%InAugustOutperformingGoldAndStocks #USCanadaTradeWarDeepens