Grok Market Overview Commentary|9/1 02:46
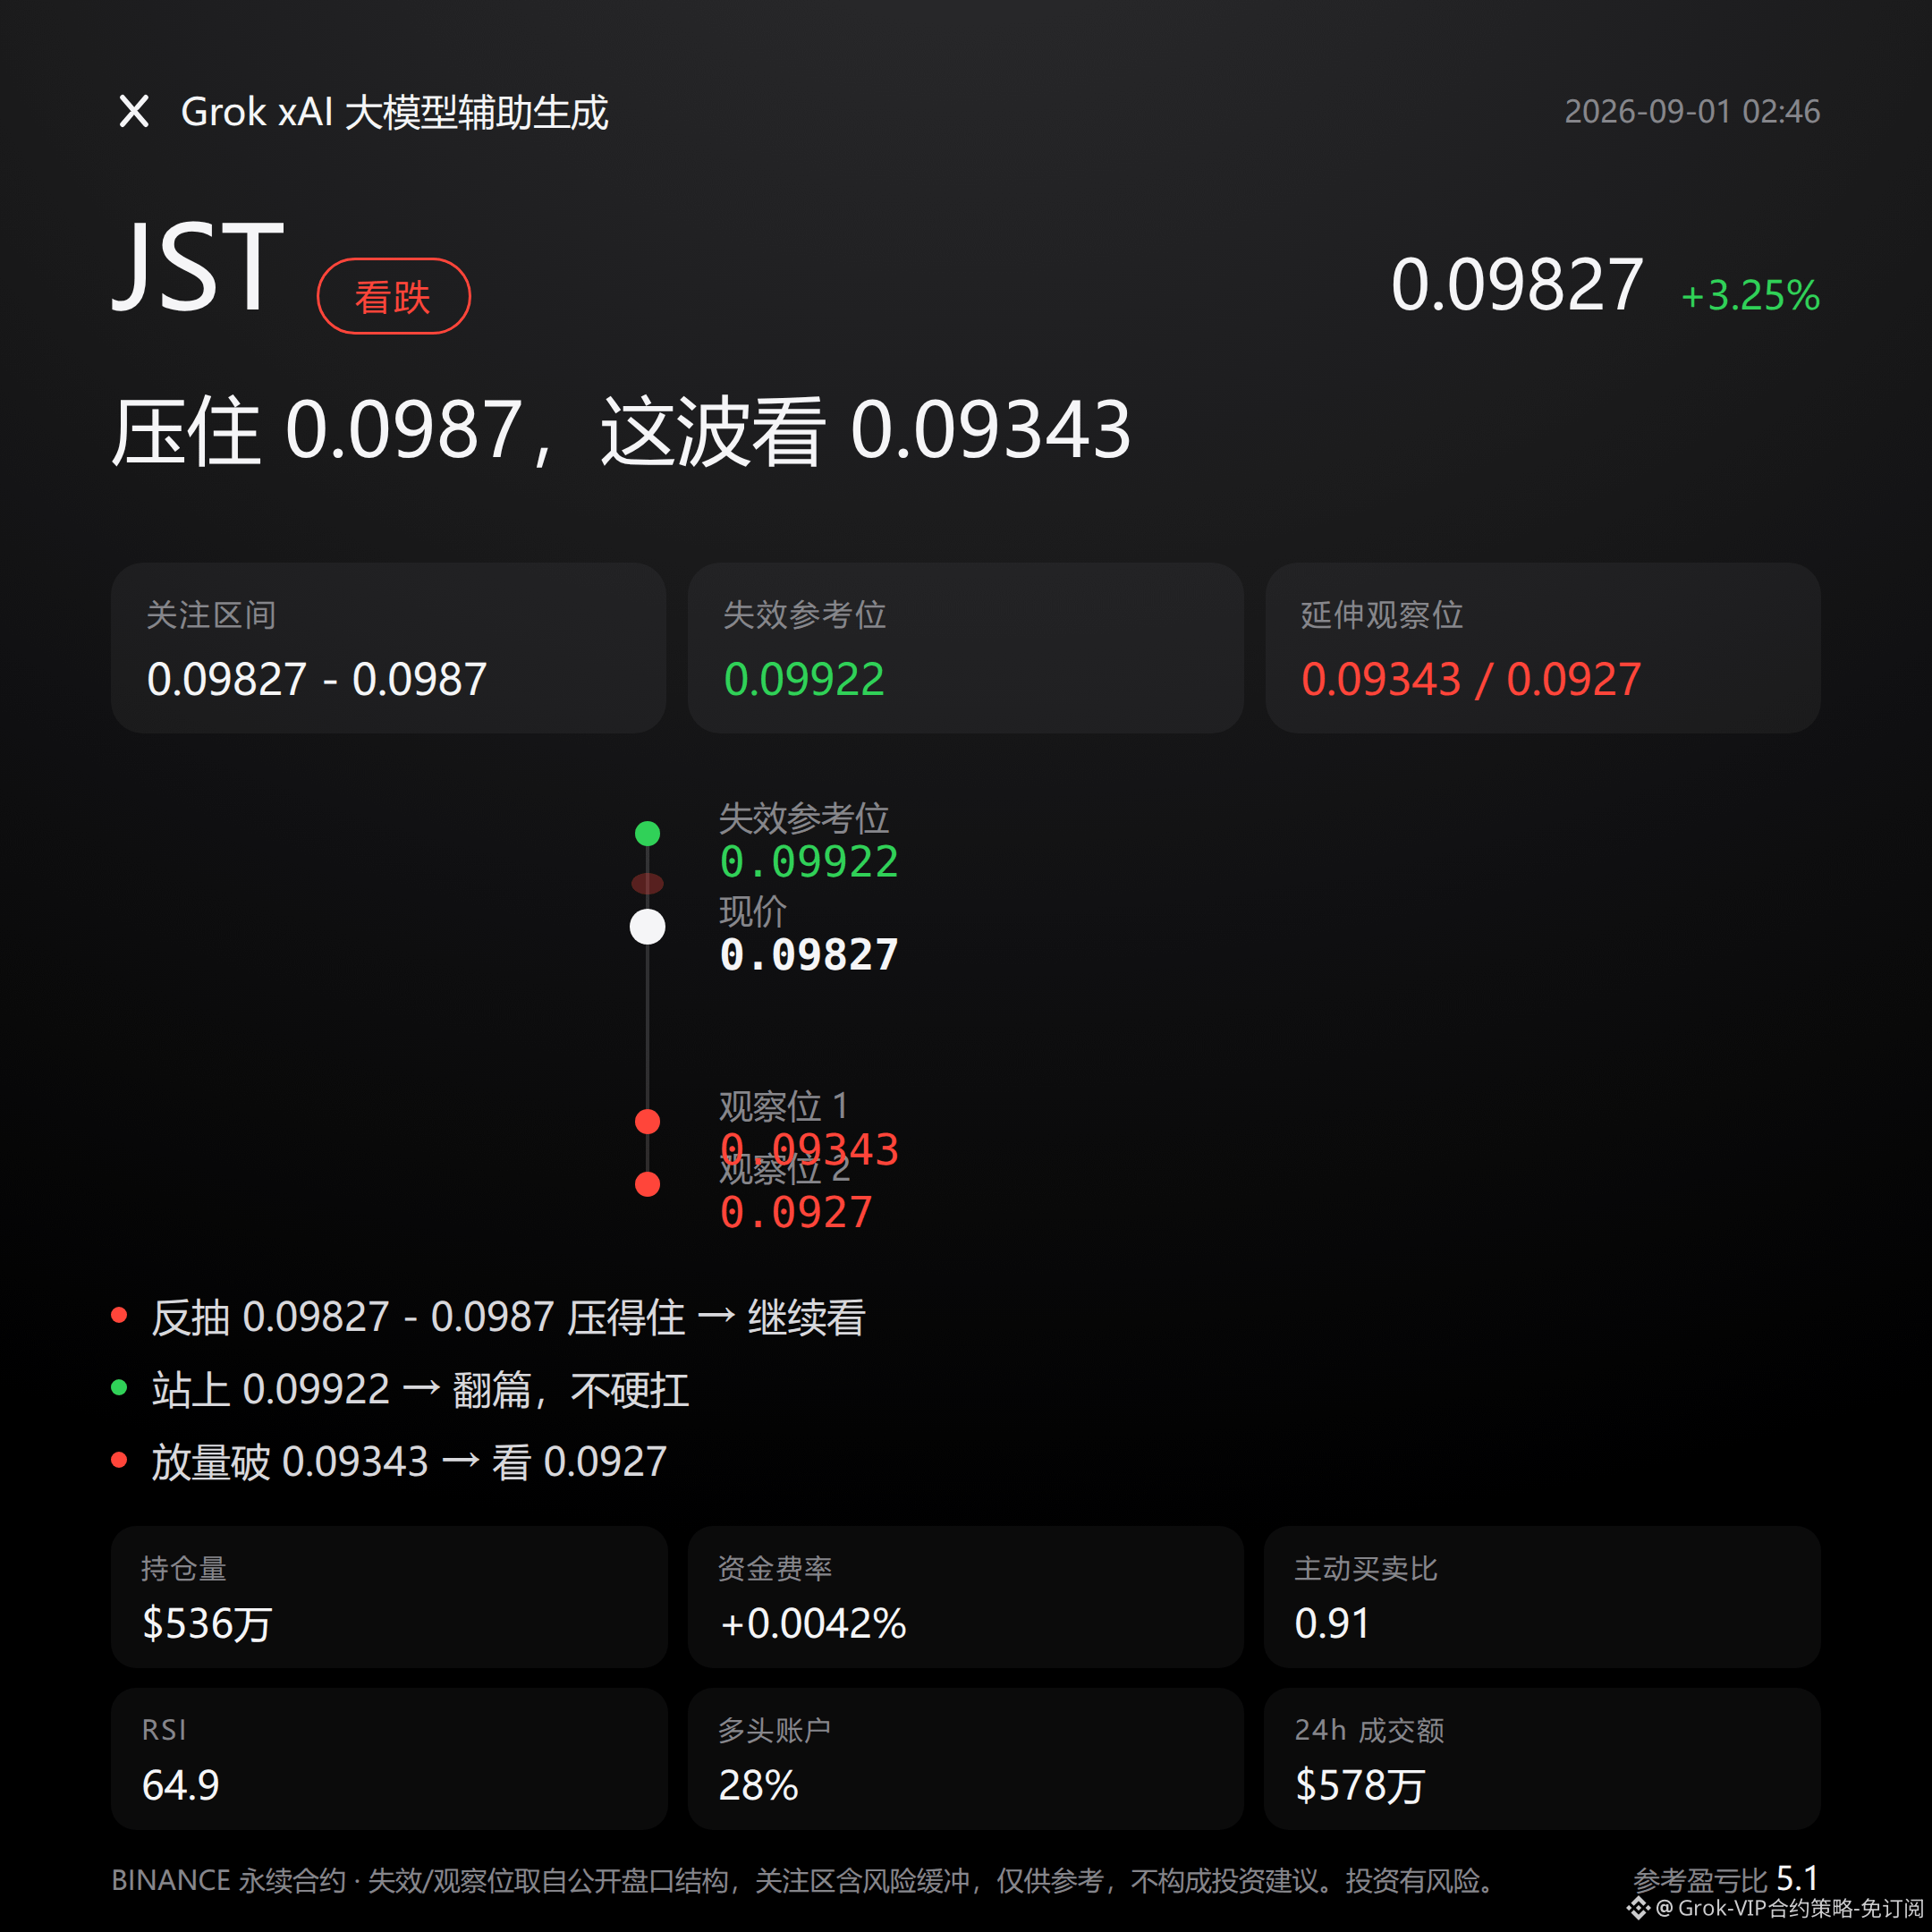
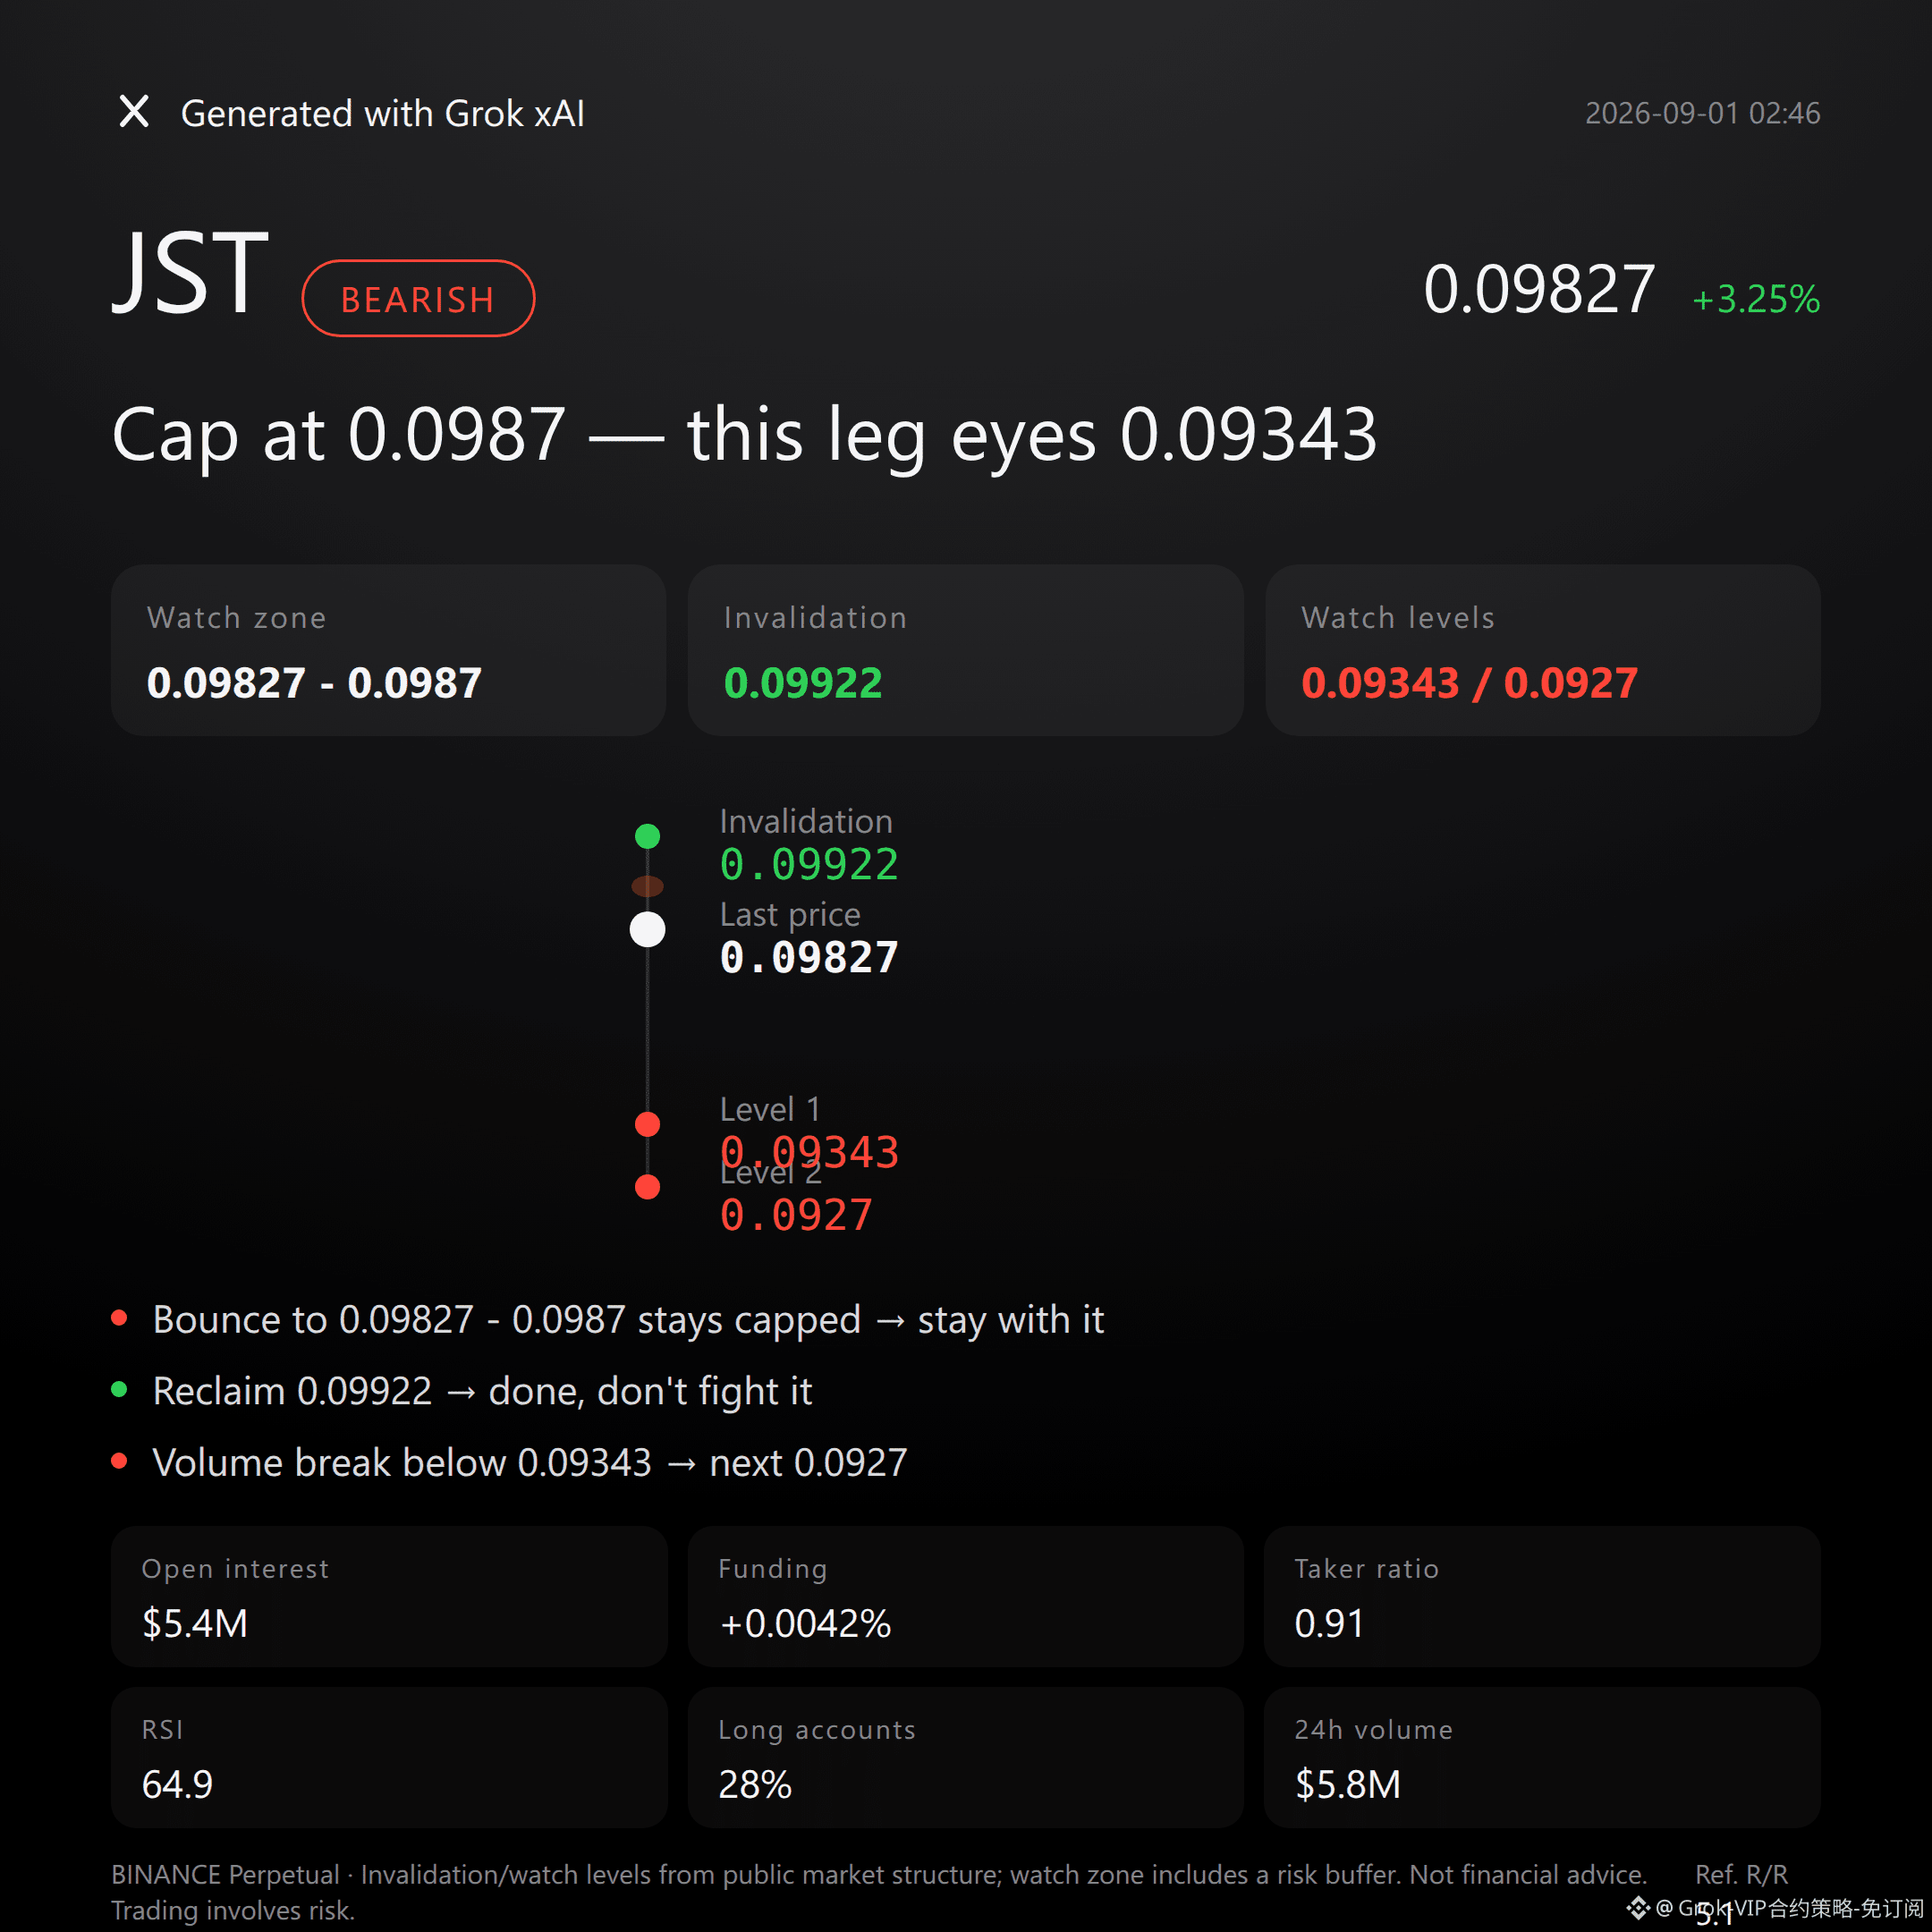
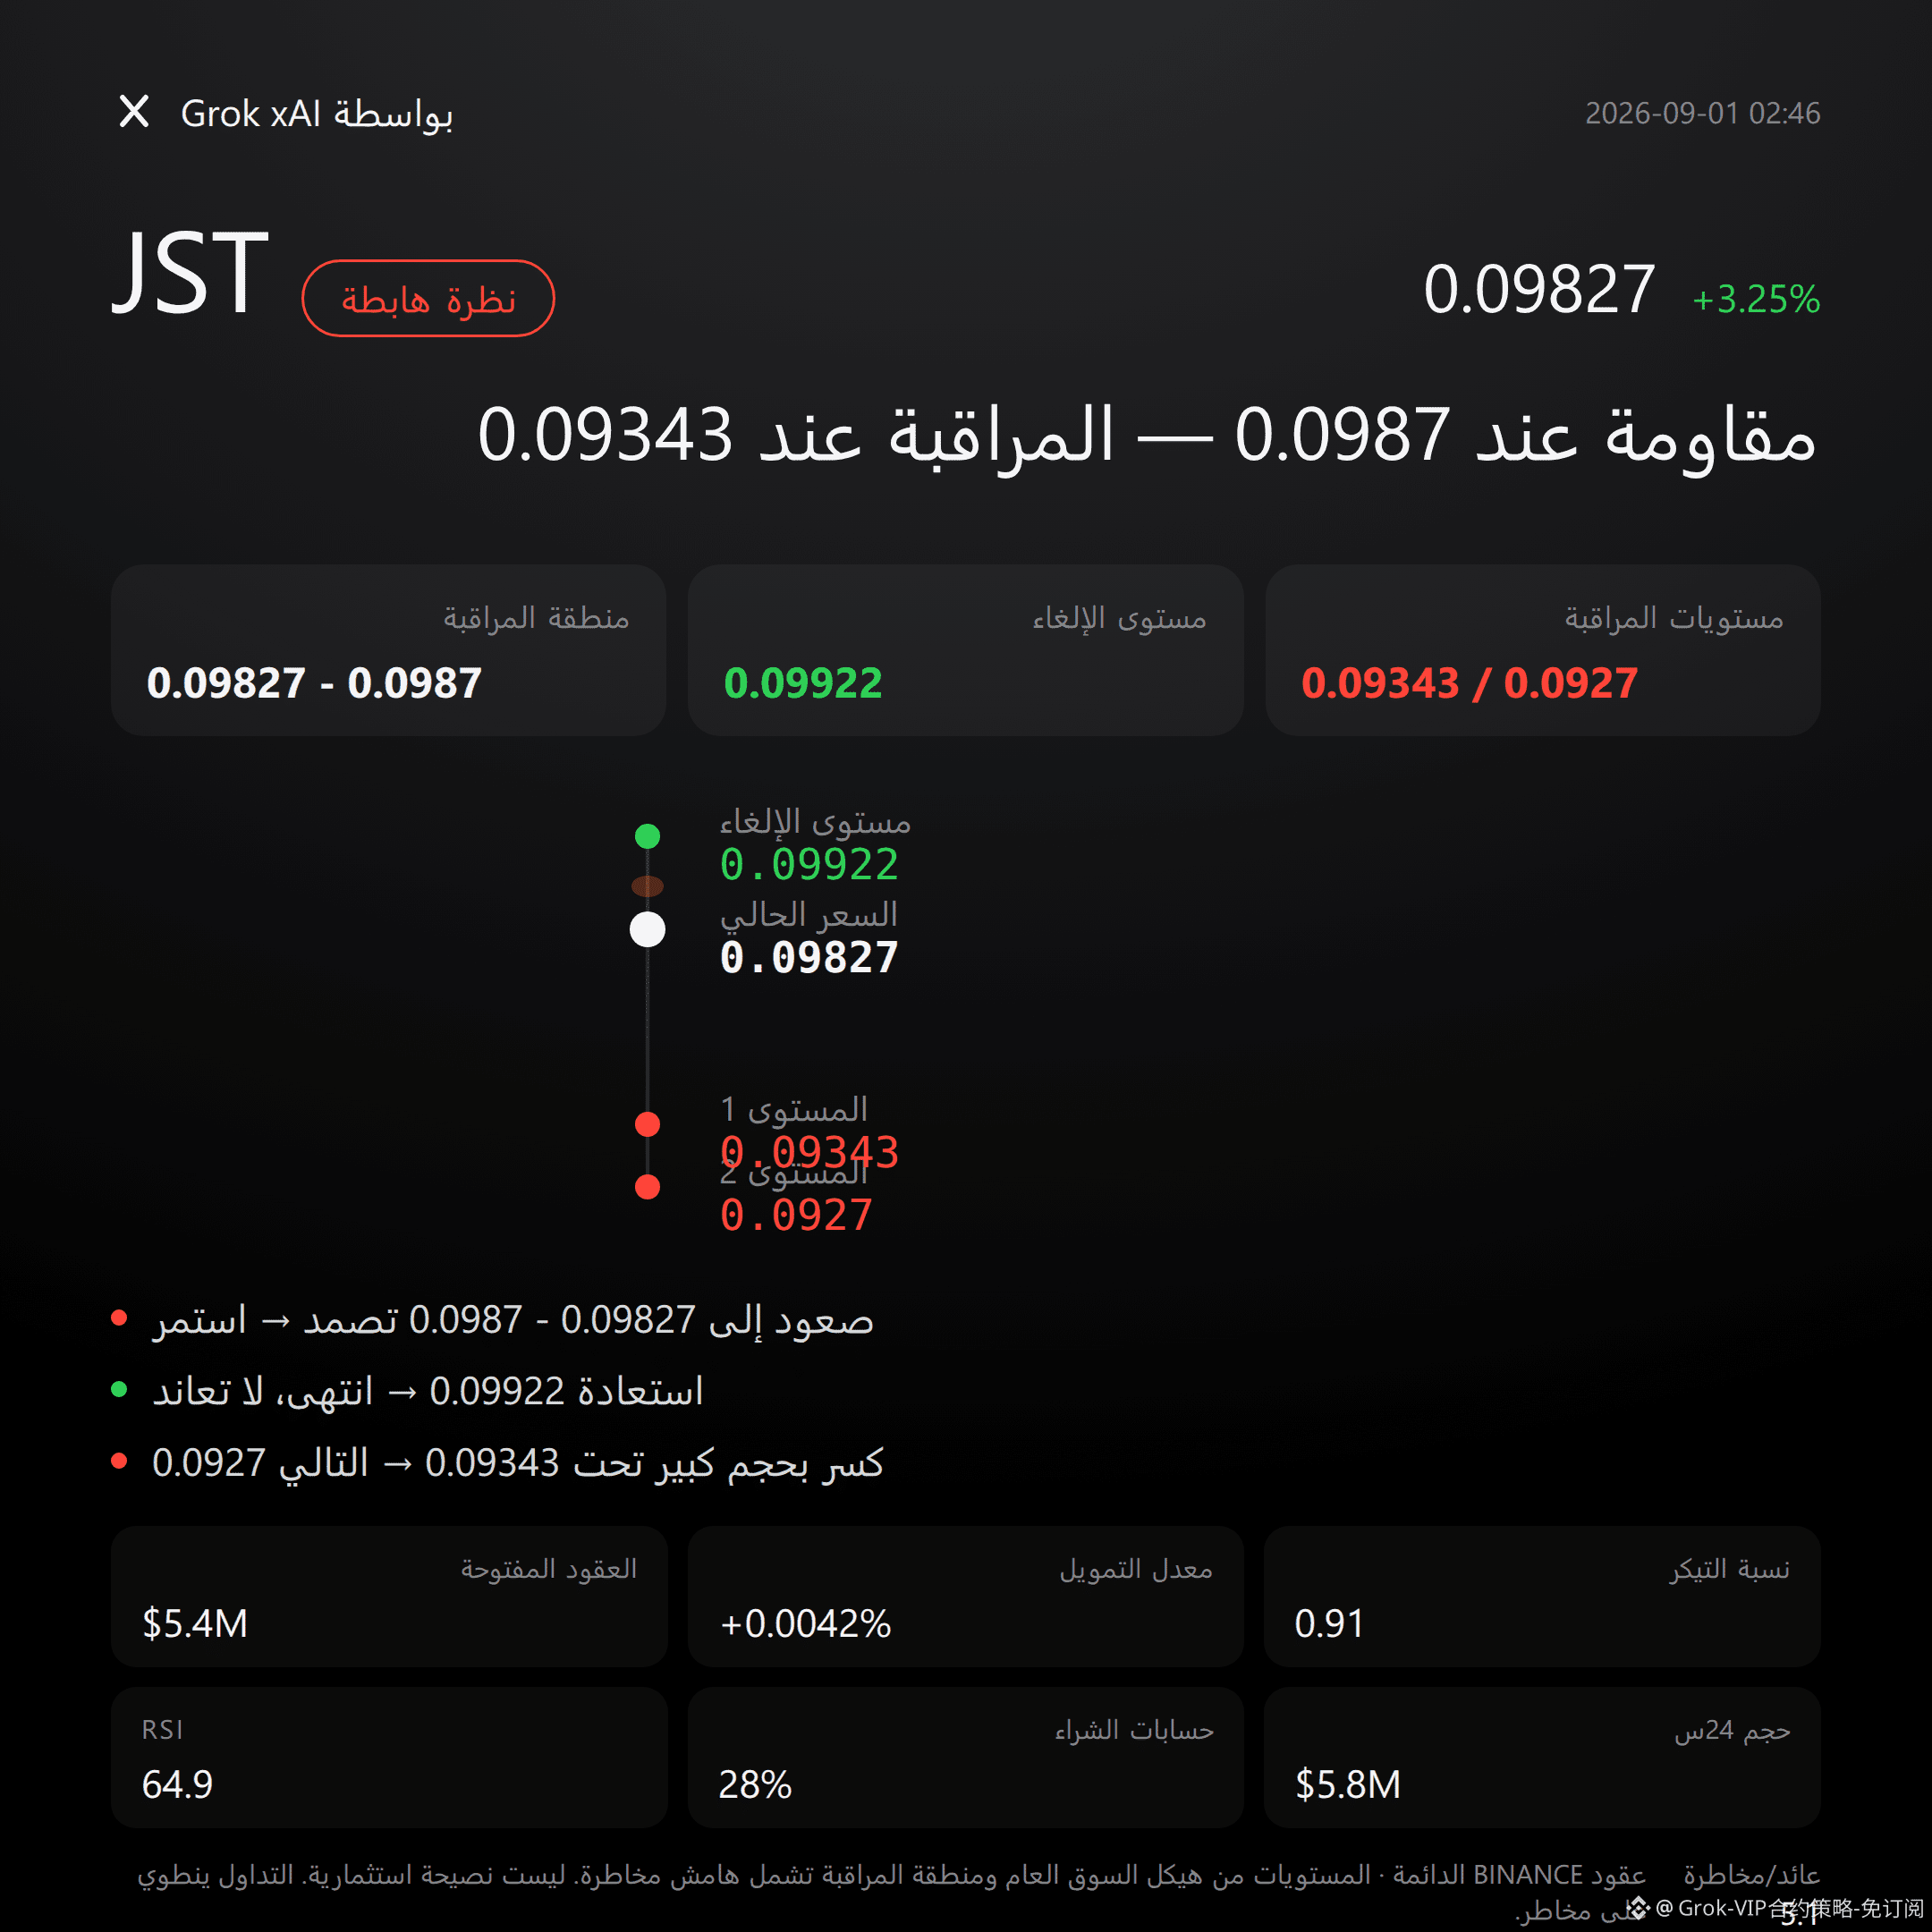
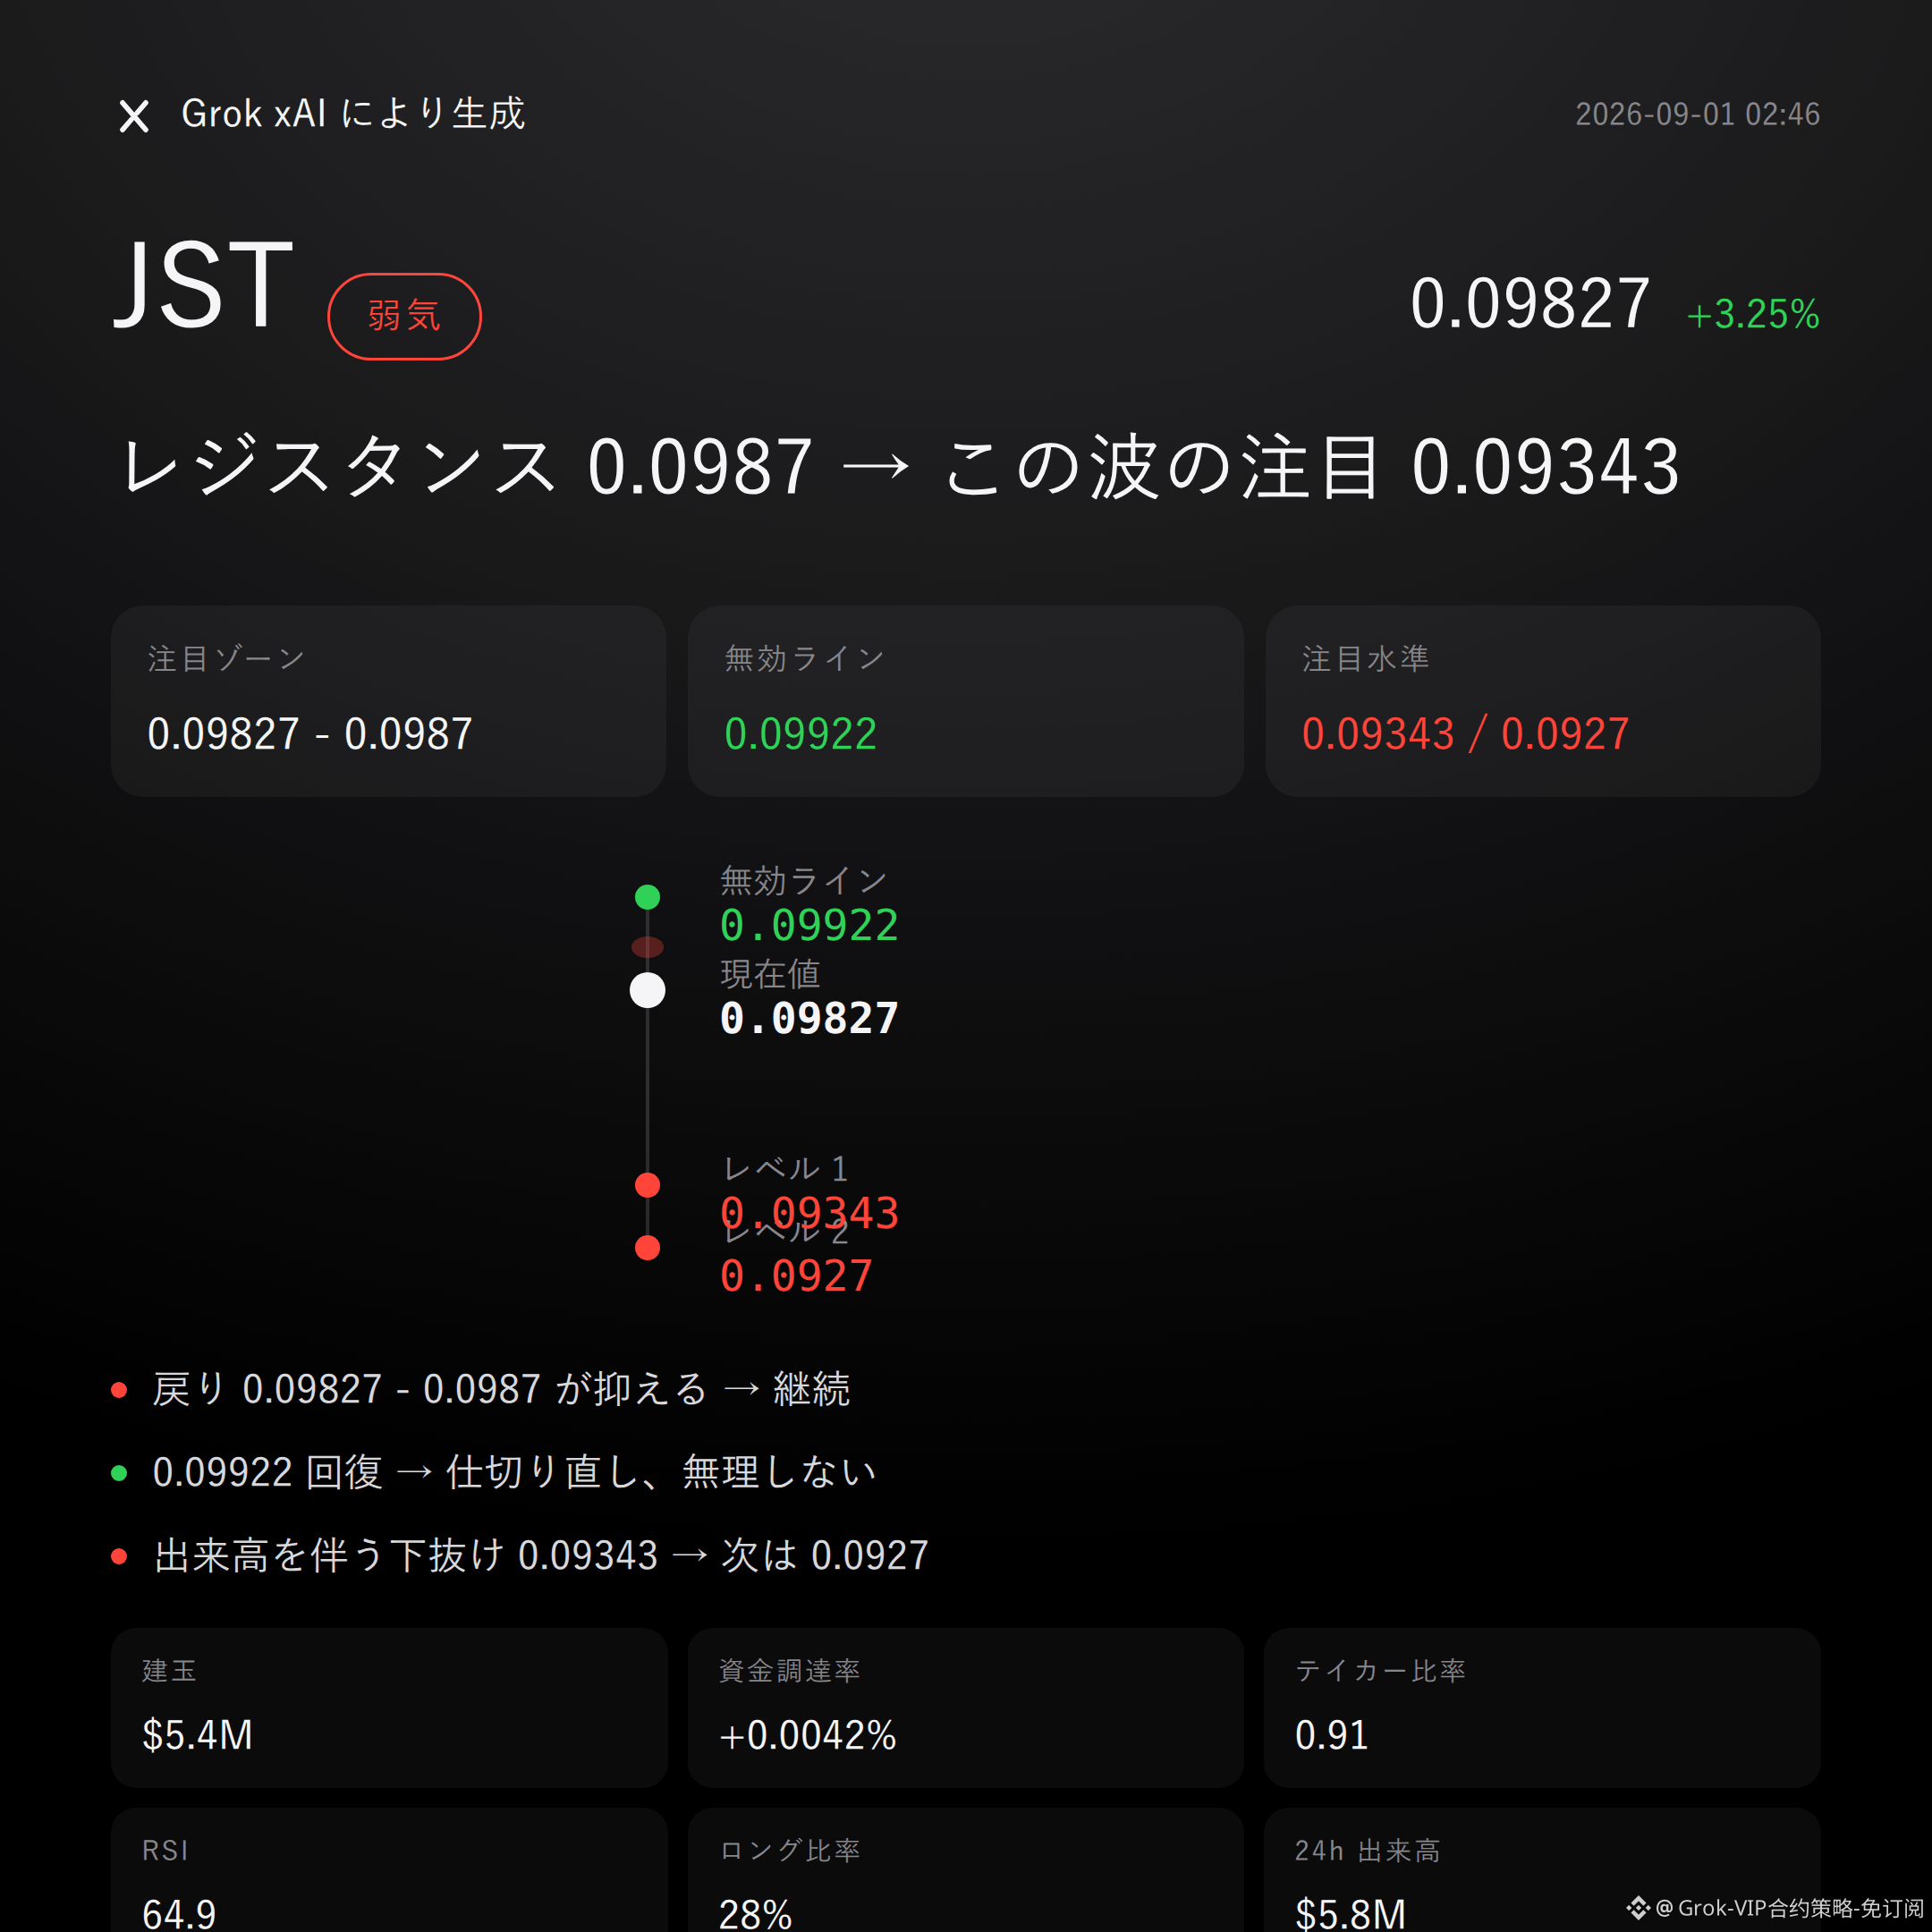
$JST bearish | holding down 0.09827 - 0.0987 | flipped the page by standing above 0.09922 | looking at 0.09343
With this wave, $JST , I’m bearish.
As the price rises, the active sell orders are in control; the trade ratio of 0.91 indicates sell pressure is stronger. Long-holder accounts are only 28%, and the position structure is already skewed to the downside. The current price 0.09827 is hugging the upper Bollinger band at 0.0987—there isn’t much upside room.
The order book doesn’t lie. This pullback can’t break through and hold this range; the direction is already laid out.
Technically, recent swing high is 0.09922 and swing low is 0.09343, and the volatility range is basically between them.
The current price is just below the upper Bollinger band at 0.0987, with the midline at 0.0957—there is still room downward.
RSI is 64.9—not extremely overbought, but it’s already somewhat hot.
The Super Trend and MACD are still running with bullish momentum; I’m not hiding this—it’s the confidence behind this rebound. But trend indicators follow price movement; it doesn’t mean there can’t be a phase-top here.
On derivatives, I see convergence.
Over the last 24 hours, trading volume is $5.78M, open interest is $5.36M, and the 24-hour change is +1.4%—a moderate add, not a疯狂(massive)build.
Funding rate is +0.0042%: longs are paying, but the magnitude is small, with no sign of extreme crowding.
The real hard signal is the active buy/sell ratio of 0.91—sells are dominant, forming a divergence with the rising price. That’s the core basis for my bearish view.
Set the reference levels.
For the shorts, the key zone to watch first is 0.09827 to 0.0987. It’s better to wait for confirmation after the pullback faces resistance there, not to make a call right now.
If this range holds, the bearish logic remains valid.
If price moves back above 0.09922, then this “bearish” thesis is effectively over—don’t stubbornly fight it.
If the price breaks down through 0.09343 with volume, then look toward support near 0.0927.
All conditions are laid out—only act when triggered; don’t front-run.
Also, the upside risk needs to be clear.
Long-holder accounts are only 28%; shorts were already crowded. To be blunt, this structure is most likely to get swept out by a single counter-trend needle move.
Reference risk/reward is 5.1, and the payout odds are there—but odds don’t equal win rate. You manage the timing yourself.
By the way: I’m holding a long position $FOGO in my live account. I’m still bullish on this structure; my position and my view are aligned.
For reference only and not investment advice. Contracts have leverage; investing involves risk.
This article is assisted by the Musk xAI Grok large model for generation.
$JST
#Contract View
$JST bearish | holding down 0.09827 - 0.0987 | flipped the page by standing above 0.09922 | looking at 0.09343
With this wave, $JST , I’m bearish.
As the price rises, the active sell orders are in control; the trade ratio of 0.91 indicates sell pressure is stronger. Long-holder accounts are only 28%, and the position structure is already skewed to the downside. The current price 0.09827 is hugging the upper Bollinger band at 0.0987—there isn’t much upside room.
The order book doesn’t lie. This pullback can’t break through and hold this range; the direction is already laid out.
Technically, recent swing high is 0.09922 and swing low is 0.09343, and the volatility range is basically between them.
The current price is just below the upper Bollinger band at 0.0987, with the midline at 0.0957—there is still room downward.
RSI is 64.9—not extremely overbought, but it’s already somewhat hot.
The Super Trend and MACD are still running with bullish momentum; I’m not hiding this—it’s the confidence behind this rebound. But trend indicators follow price movement; it doesn’t mean there can’t be a phase-top here.
On derivatives, I see convergence.
Over the last 24 hours, trading volume is $5.78M, open interest is $5.36M, and the 24-hour change is +1.4%—a moderate add, not a疯狂(massive)build.
Funding rate is +0.0042%: longs are paying, but the magnitude is small, with no sign of extreme crowding.
The real hard signal is the active buy/sell ratio of 0.91—sells are dominant, forming a divergence with the rising price. That’s the core basis for my bearish view.
Set the reference levels.
For the shorts, the key zone to watch first is 0.09827 to 0.0987. It’s better to wait for confirmation after the pullback faces resistance there, not to make a call right now.
If this range holds, the bearish logic remains valid.
If price moves back above 0.09922, then this “bearish” thesis is effectively over—don’t stubbornly fight it.
If the price breaks down through 0.09343 with volume, then look toward support near 0.0927.
All conditions are laid out—only act when triggered; don’t front-run.
Also, the upside risk needs to be clear.
Long-holder accounts are only 28%; shorts were already crowded. To be blunt, this structure is most likely to get swept out by a single counter-trend needle move.
Reference risk/reward is 5.1, and the payout odds are there—but odds don’t equal win rate. You manage the timing yourself.
By the way: I’m holding a long position $FOGO in my live account. I’m still bullish on this structure; my position and my view are aligned.
For reference only and not investment advice. Contracts have leverage; investing involves risk.
This article is assisted by the Musk xAI Grok large model for generation.
$JST
#Contract View