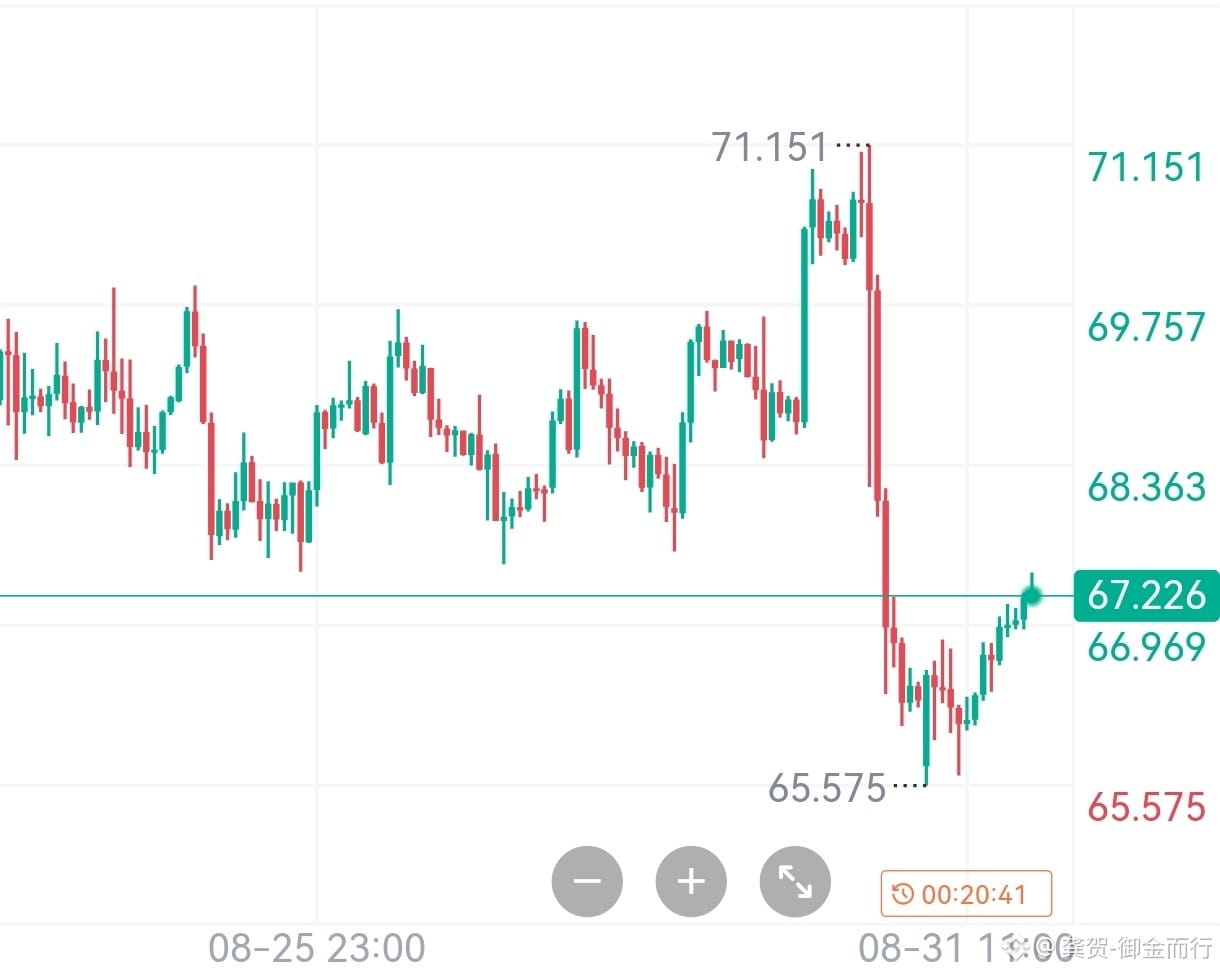
8.31 Silver
From the hourly timeframe, after Silver experienced a sharp drop, it has unfolded a relatively strong technical rebound. The Bollinger channel remains broadly expanding downward, and the price has now broken above and stabilized around the midline, approaching the upper band to the upside. Although the rebound strength is relatively strong, the overall pattern of the channel shifting downward has not changed. The suppressive effect from the upper band is gradually increasing, and when price touches the upper band, it will very likely face strong resistance.
The MACD’s two lines form a golden cross at a very deep position below the zero axis, and the volume histogram continues to expand, indicating that short-term bullish momentum is being released. However, since both indicator lines still remain far below the zero axis, this oversold rebound is more of a correction of the deviation rate. Once price approaches the resistance area near the upper band, bullish momentum will gradually weaken, and the process of the fast and slow lines moving back toward the zero axis may potentially stall at any time.
(Enter at 67.7, add at 68.5, hedge at 69.2; looking for 65.2-63)
The above is an objective analysis of the market conditions and does not constitute any investment advice. The market involves uncertainty. Please make specific trading decisions based on the real-time market and your own risk tolerance, and independently and prudently judge while bearing the corresponding risks.
$NVDA.US $AAPL.US $XAG
From the hourly timeframe, after Silver experienced a sharp drop, it has unfolded a relatively strong technical rebound. The Bollinger channel remains broadly expanding downward, and the price has now broken above and stabilized around the midline, approaching the upper band to the upside. Although the rebound strength is relatively strong, the overall pattern of the channel shifting downward has not changed. The suppressive effect from the upper band is gradually increasing, and when price touches the upper band, it will very likely face strong resistance.
The MACD’s two lines form a golden cross at a very deep position below the zero axis, and the volume histogram continues to expand, indicating that short-term bullish momentum is being released. However, since both indicator lines still remain far below the zero axis, this oversold rebound is more of a correction of the deviation rate. Once price approaches the resistance area near the upper band, bullish momentum will gradually weaken, and the process of the fast and slow lines moving back toward the zero axis may potentially stall at any time.
(Enter at 67.7, add at 68.5, hedge at 69.2; looking for 65.2-63)
The above is an objective analysis of the market conditions and does not constitute any investment advice. The market involves uncertainty. Please make specific trading decisions based on the real-time market and your own risk tolerance, and independently and prudently judge while bearing the corresponding risks.
$NVDA.US $AAPL.US $XAG