【 79300 meets resistance and the script兑现!Monthly line big bullish candle, weekly line weakness, 4-hour top divergence!$BTC what happens next?】
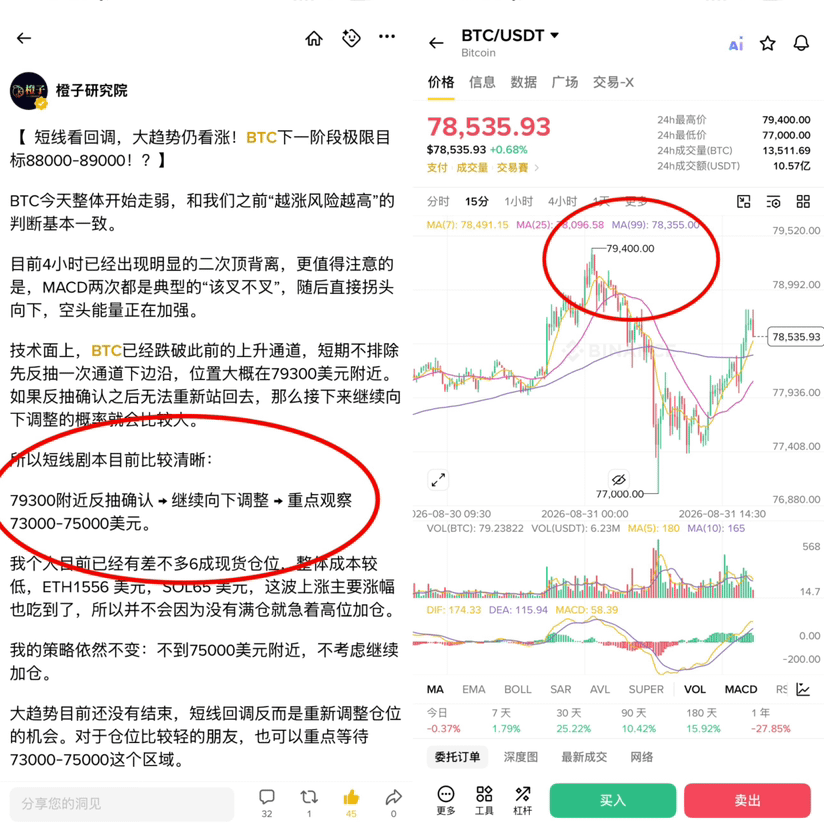
Although weekend low liquidity is very grinding, BTC is still slowly walking through the script of a bullish retracement after breaking the lower edge of the channel. It met resistance and pulled back around 79300, as we expected, getting stuck in a range【❤️as shown in Figure 3】
As usual, let’s first look at the monthly chart. The monthly line big bullish candle is basically no longer much of a question. If you look closely, you’ll notice that even though it moved strongly, it still hasn’t broken out of a box range. So we can make two judgments. First, the big bullish candle effectively closes off the probability of a much lower new low in the later stage. Under the condition that no major “black swan” appears, the likelihood of BTC in the $50k range becoming the bottom is already quite high. Also, after MACD touched the zero axis, it began to flatten, which provides strong confirmation.
Second, since it hasn’t broken through the box in one go, the continuity of the upward momentum here needs observation.
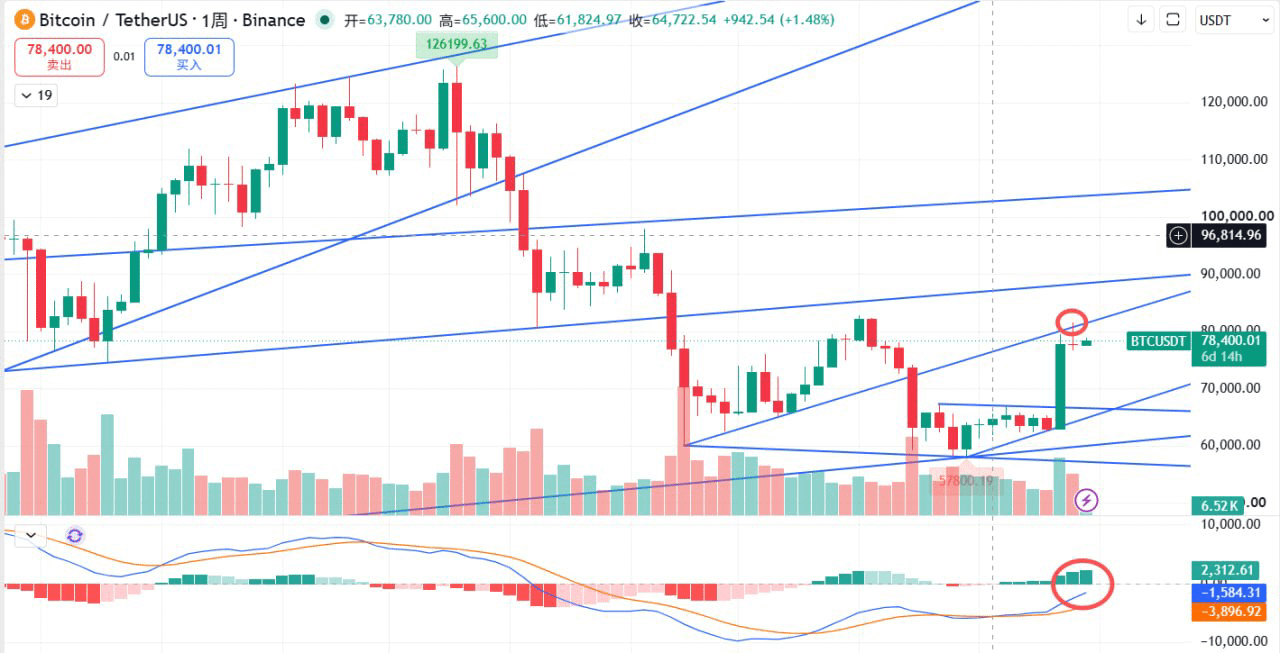
Now let’s look at the weekly chart: a long upper-shadow cross star, heavier selling pressure, rally then pullback, and the trend is showing signs of fatigue. In terms of position, it is far from the moving average support, and MACD is also about to be suppressed as it approaches the zero axis—there is a need for a short-term correction【❤️as shown in Figure 1】
On the daily chart, it is still in the process of confirming the channel breakdown. The bulls’ trend is still there, and a daily-level divergence has not appeared yet.
On the 4-hour chart: a second top divergence, MACD crossing below the zero axis, and insufficient bullish momentum—so the probability of a continued pullback is high.
Putting it all together, it seems each timeframe has its own idea, so the next move will inevitably be complicated and changeable. But considering everything overall, the probability is higher that the weekly and monthly big-picture performance just needs a breather and then rises again.
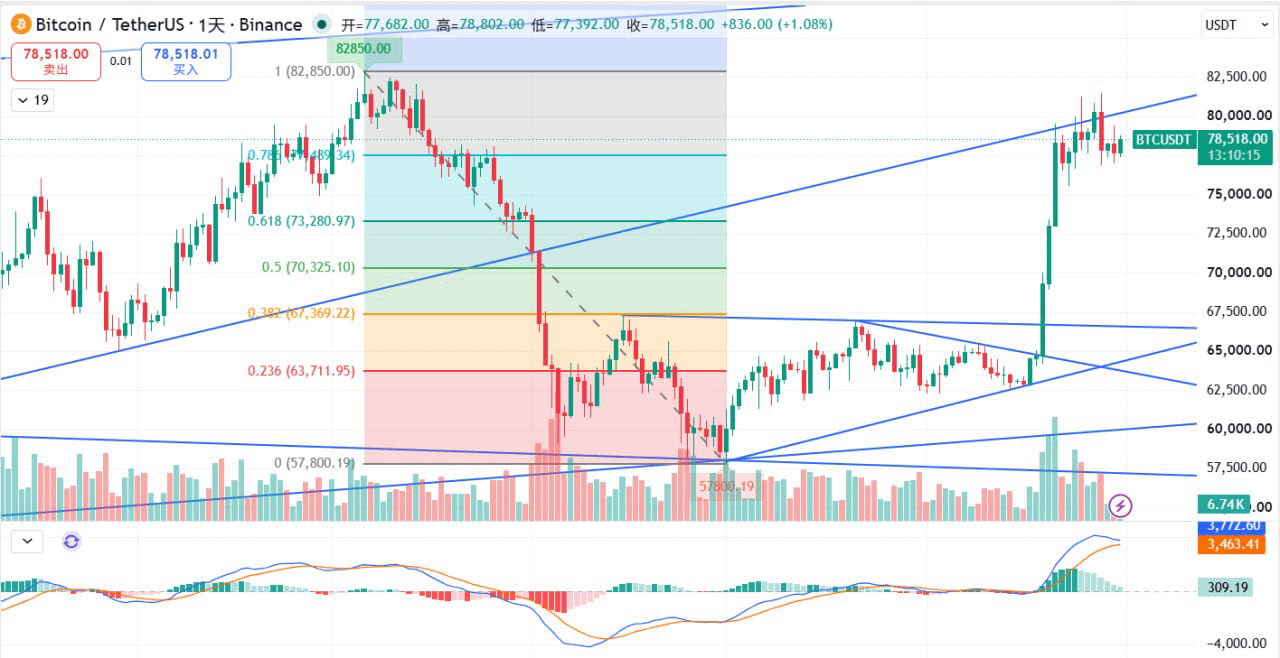
Therefore, we still maintain the prior expectation of a rise around the 0.618 Fibonacci retracement level, roughly the 73,000–75,000 range. This will be a good spot for a second entry【❤️as shown in Figure 2】
Historically, in September BTC’s performance most of the time has not been very satisfactory. There’s also a major crypto policy bill to be revealed mid-month whether it passes or not, so volatility is definitely not small. In terms of operations, it’s better to remain more conservative!
Trading situation: personal position and community position are 60%: ETH1556 cost $1, S0L65 cost, SUI0.806 cost (SUI rode up and gained 26% earlier; currently it’s giving back the profit)
#BTC走势分析 #ETH $SOL $ETH
Although weekend low liquidity is very grinding, BTC is still slowly walking through the script of a bullish retracement after breaking the lower edge of the channel. It met resistance and pulled back around 79300, as we expected, getting stuck in a range【❤️as shown in Figure 3】
As usual, let’s first look at the monthly chart. The monthly line big bullish candle is basically no longer much of a question. If you look closely, you’ll notice that even though it moved strongly, it still hasn’t broken out of a box range. So we can make two judgments. First, the big bullish candle effectively closes off the probability of a much lower new low in the later stage. Under the condition that no major “black swan” appears, the likelihood of BTC in the $50k range becoming the bottom is already quite high. Also, after MACD touched the zero axis, it began to flatten, which provides strong confirmation.
Second, since it hasn’t broken through the box in one go, the continuity of the upward momentum here needs observation.
Now let’s look at the weekly chart: a long upper-shadow cross star, heavier selling pressure, rally then pullback, and the trend is showing signs of fatigue. In terms of position, it is far from the moving average support, and MACD is also about to be suppressed as it approaches the zero axis—there is a need for a short-term correction【❤️as shown in Figure 1】
On the daily chart, it is still in the process of confirming the channel breakdown. The bulls’ trend is still there, and a daily-level divergence has not appeared yet.
On the 4-hour chart: a second top divergence, MACD crossing below the zero axis, and insufficient bullish momentum—so the probability of a continued pullback is high.
Putting it all together, it seems each timeframe has its own idea, so the next move will inevitably be complicated and changeable. But considering everything overall, the probability is higher that the weekly and monthly big-picture performance just needs a breather and then rises again.
Therefore, we still maintain the prior expectation of a rise around the 0.618 Fibonacci retracement level, roughly the 73,000–75,000 range. This will be a good spot for a second entry【❤️as shown in Figure 2】
Historically, in September BTC’s performance most of the time has not been very satisfactory. There’s also a major crypto policy bill to be revealed mid-month whether it passes or not, so volatility is definitely not small. In terms of operations, it’s better to remain more conservative!
Trading situation: personal position and community position are 60%: ETH1556 cost $1, S0L65 cost, SUI0.806 cost (SUI rode up and gained 26% earlier; currently it’s giving back the profit)
#BTC走势分析 #ETH $SOL $ETH