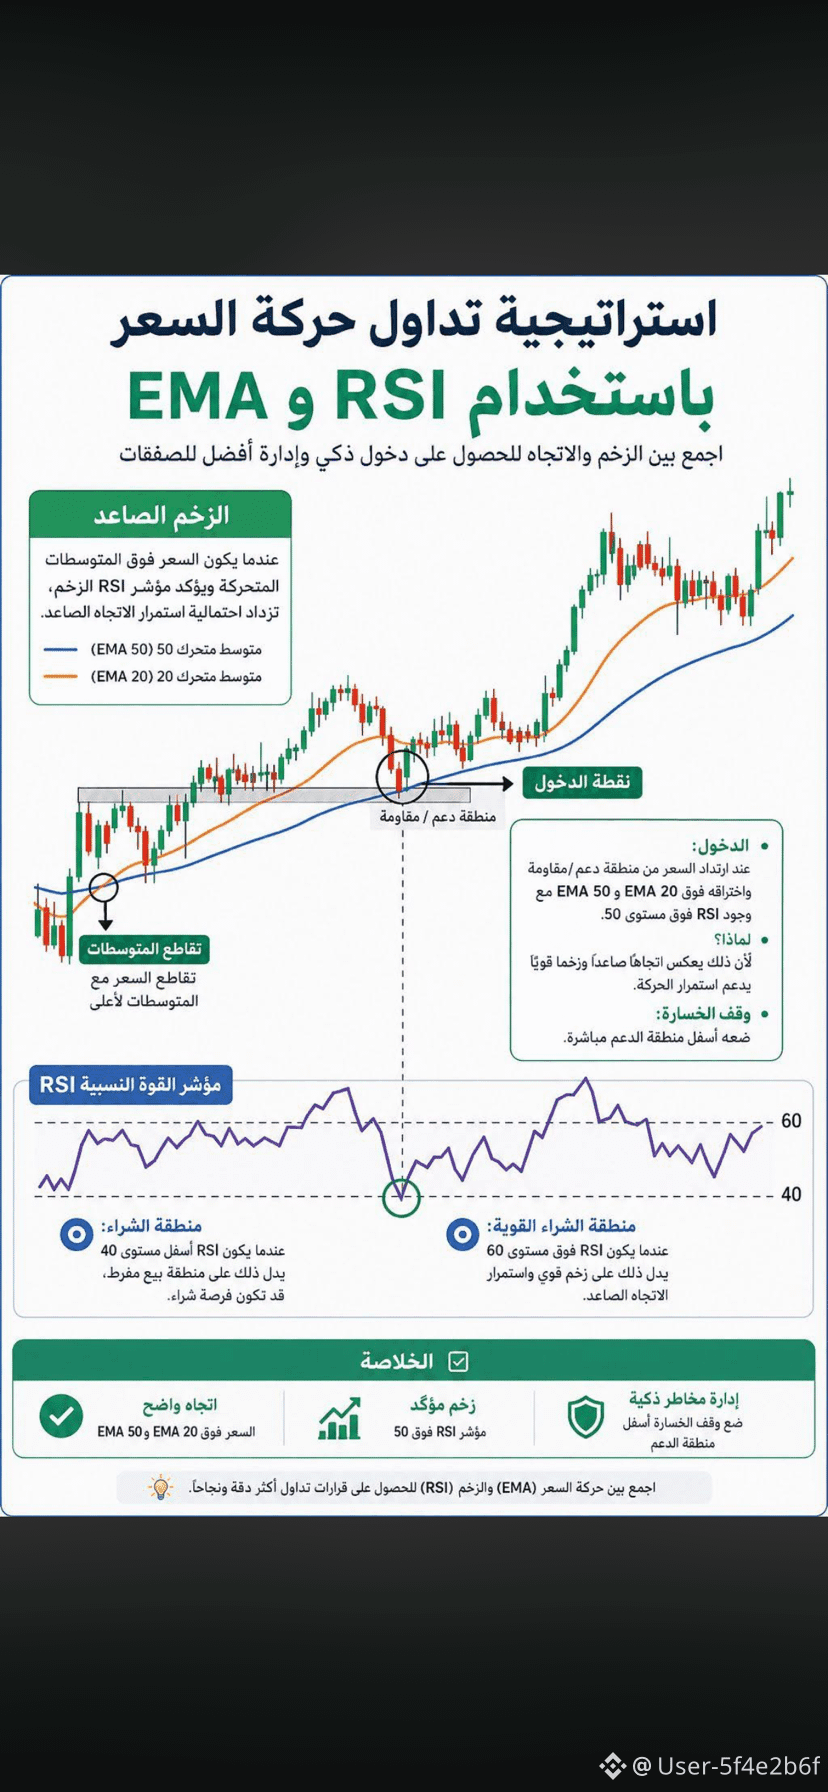
Smart and distinctive strategies that combine simplicity with strong technical confirmation and free indicators
What distinguishes this strategy is that it does not rely on a single signal, but rather combines trend, momentum, and price action. This helps you make a more organized and clear trading decision.
Support and resistance zones = reading + EMA + RSI
Best for the market
Determining the trend:
Using EMA 20 and EMA 50 helps identify the overall trend, especially when the price moves above both averages and EMA 20 is higher than EMA 50.
Momentum confirmation:
RSI provides additional confirmation of the strength of the move. Having it above 50 indicates a positive bias, and above 60 reflects stronger bullish momentum.
Choosing the entry:
Instead of chasing the price after a rise, the strategy waits for the price to return to a support area or retest it, then we look for confirmation from price action and RSI.
Risk management:
The stop-loss is placed below the important support zone, with position sizing set according to the level of risk.
In the end:
The strength of this strategy is not in the number of indicators, but in the alignment of more than one factor in the same direction; that is what makes it a beautiful and organized framework for analyzing trading opportunities.
As usual, there is no guaranteed strategy, so backtesting and capital management remain two essential elements.#USStrikesIranianRocketLaunchers #YenBreaks160AgainstDollar #UKReleasesFirstCryptoGainsTaxStats #BrentRisesAbove$90 #SKHynixStudiesJapanMemoryChipVenture 🤑🤑🤑🤑🤑🤑🤑🤑🤑🤑
What distinguishes this strategy is that it does not rely on a single signal, but rather combines trend, momentum, and price action. This helps you make a more organized and clear trading decision.
Support and resistance zones = reading + EMA + RSI
Best for the market
Determining the trend:
Using EMA 20 and EMA 50 helps identify the overall trend, especially when the price moves above both averages and EMA 20 is higher than EMA 50.
Momentum confirmation:
RSI provides additional confirmation of the strength of the move. Having it above 50 indicates a positive bias, and above 60 reflects stronger bullish momentum.
Choosing the entry:
Instead of chasing the price after a rise, the strategy waits for the price to return to a support area or retest it, then we look for confirmation from price action and RSI.
Risk management:
The stop-loss is placed below the important support zone, with position sizing set according to the level of risk.
In the end:
The strength of this strategy is not in the number of indicators, but in the alignment of more than one factor in the same direction; that is what makes it a beautiful and organized framework for analyzing trading opportunities.
As usual, there is no guaranteed strategy, so backtesting and capital management remain two essential elements.#USStrikesIranianRocketLaunchers #YenBreaks160AgainstDollar #UKReleasesFirstCryptoGainsTaxStats #BrentRisesAbove$90 #SKHynixStudiesJapanMemoryChipVenture 🤑🤑🤑🤑🤑🤑🤑🤑🤑🤑