
Post



花涧空
·
--
📢 Opinion|$BTC Again Significantly Underperforms the Nasdaq—Will History Recreate an Independent Major Bull Run for the Third Time?
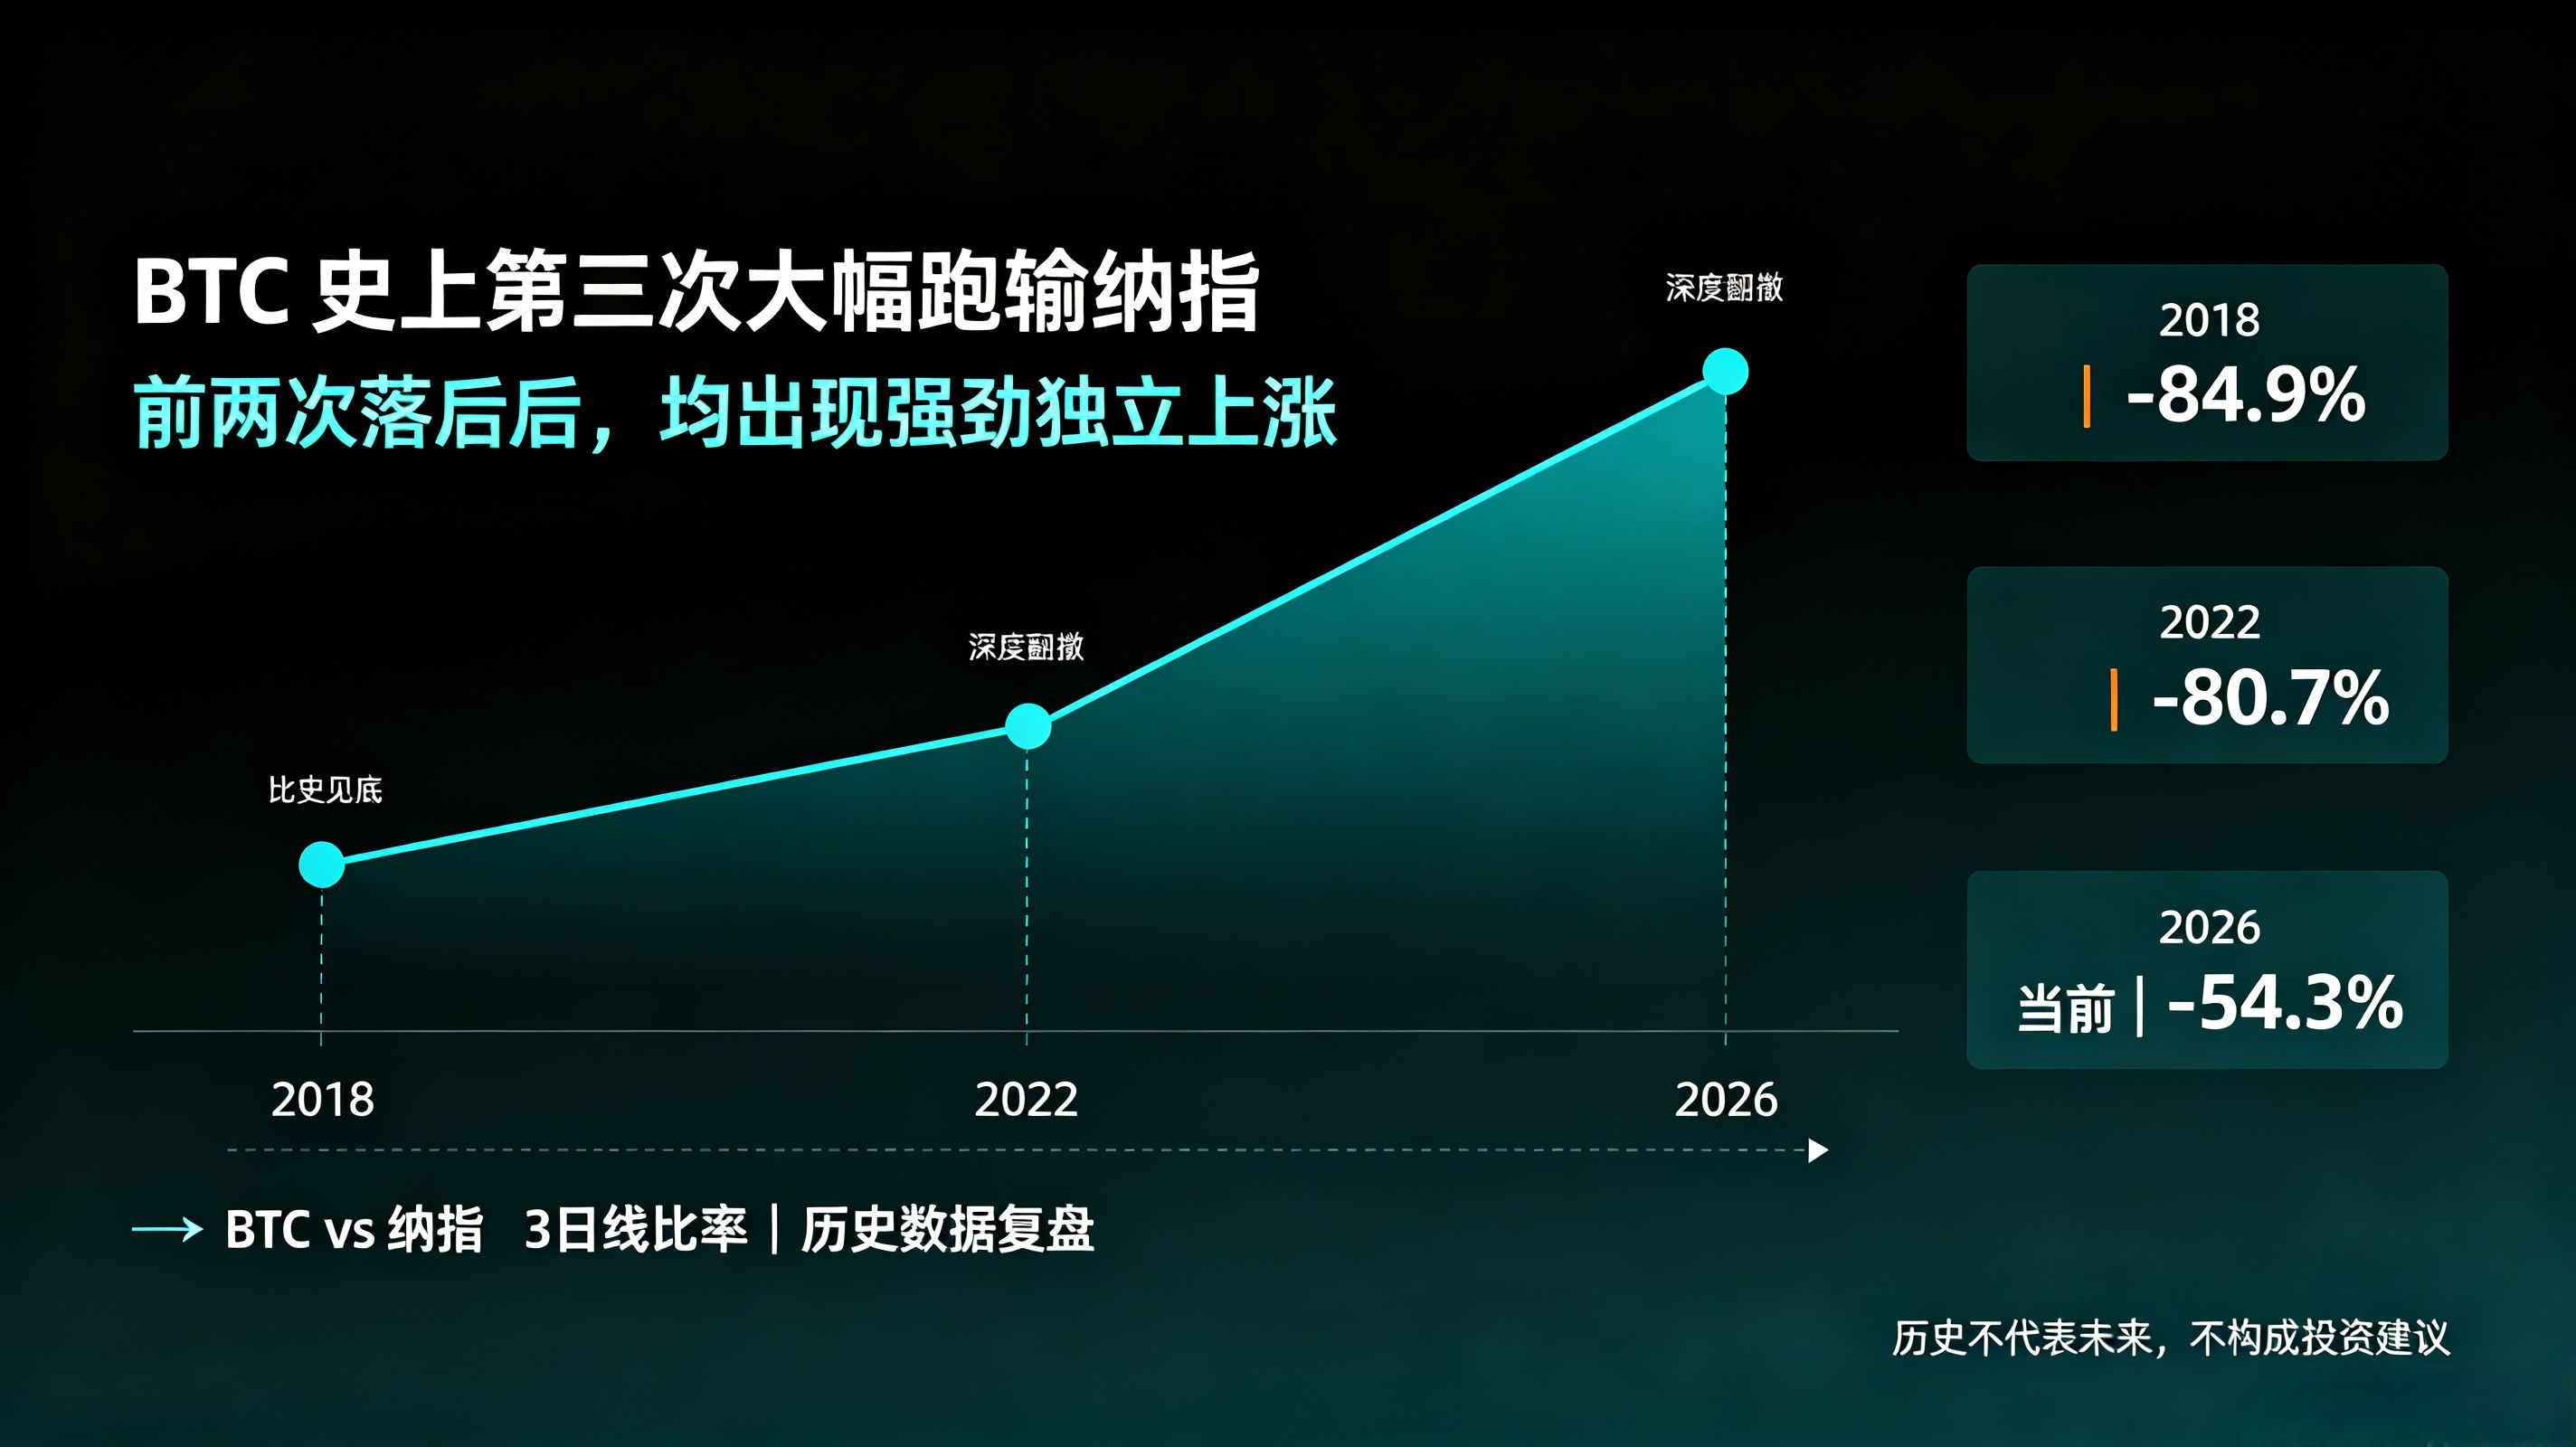
On August 30, analyst Rekt Fencer shared a BTC/Nasdaq 3-day ratio chart. Data shows that this ratio has experienced three deep drawdowns: ‑84.9% in 2018, ‑80.7% in 2022, and ‑54.3% in 2026 during this latest drawdown.
Looking back at history, after the first two instances in which Bitcoin fell behind the Nasdaq by such a large margin, BTC went on to deliver an independent strong uptrend that broke away from tech stocks, followed by a wave of intense upside momentum.
Now, as the ratio falls again into historically extreme ranges, many market observers believe that a bottoming area is drawing near. If historical patterns repeat, Bitcoin could shake off U.S. stocks and restart its own行情.
#比特币现货ETF结束9日净流入
#首笔抗量子比特币交易主网完成
⚠️For historical data review only; history does not indicate the future and does not constitute investment advice.
On August 30, analyst Rekt Fencer shared a BTC/Nasdaq 3-day ratio chart. Data shows that this ratio has experienced three deep drawdowns: ‑84.9% in 2018, ‑80.7% in 2022, and ‑54.3% in 2026 during this latest drawdown.
Looking back at history, after the first two instances in which Bitcoin fell behind the Nasdaq by such a large margin, BTC went on to deliver an independent strong uptrend that broke away from tech stocks, followed by a wave of intense upside momentum.
Now, as the ratio falls again into historically extreme ranges, many market observers believe that a bottoming area is drawing near. If historical patterns repeat, Bitcoin could shake off U.S. stocks and restart its own行情.
#比特币现货ETF结束9日净流入
#首笔抗量子比特币交易主网完成
⚠️For historical data review only; history does not indicate the future and does not constitute investment advice.
Disclaimer: Includes third-party opinions. No advice. Binance AI may be used without guarantee. See T&Cs.