#BTC Weekly Report‼️ (August Week 5)
【Weekly (Weekly Chart) Level】
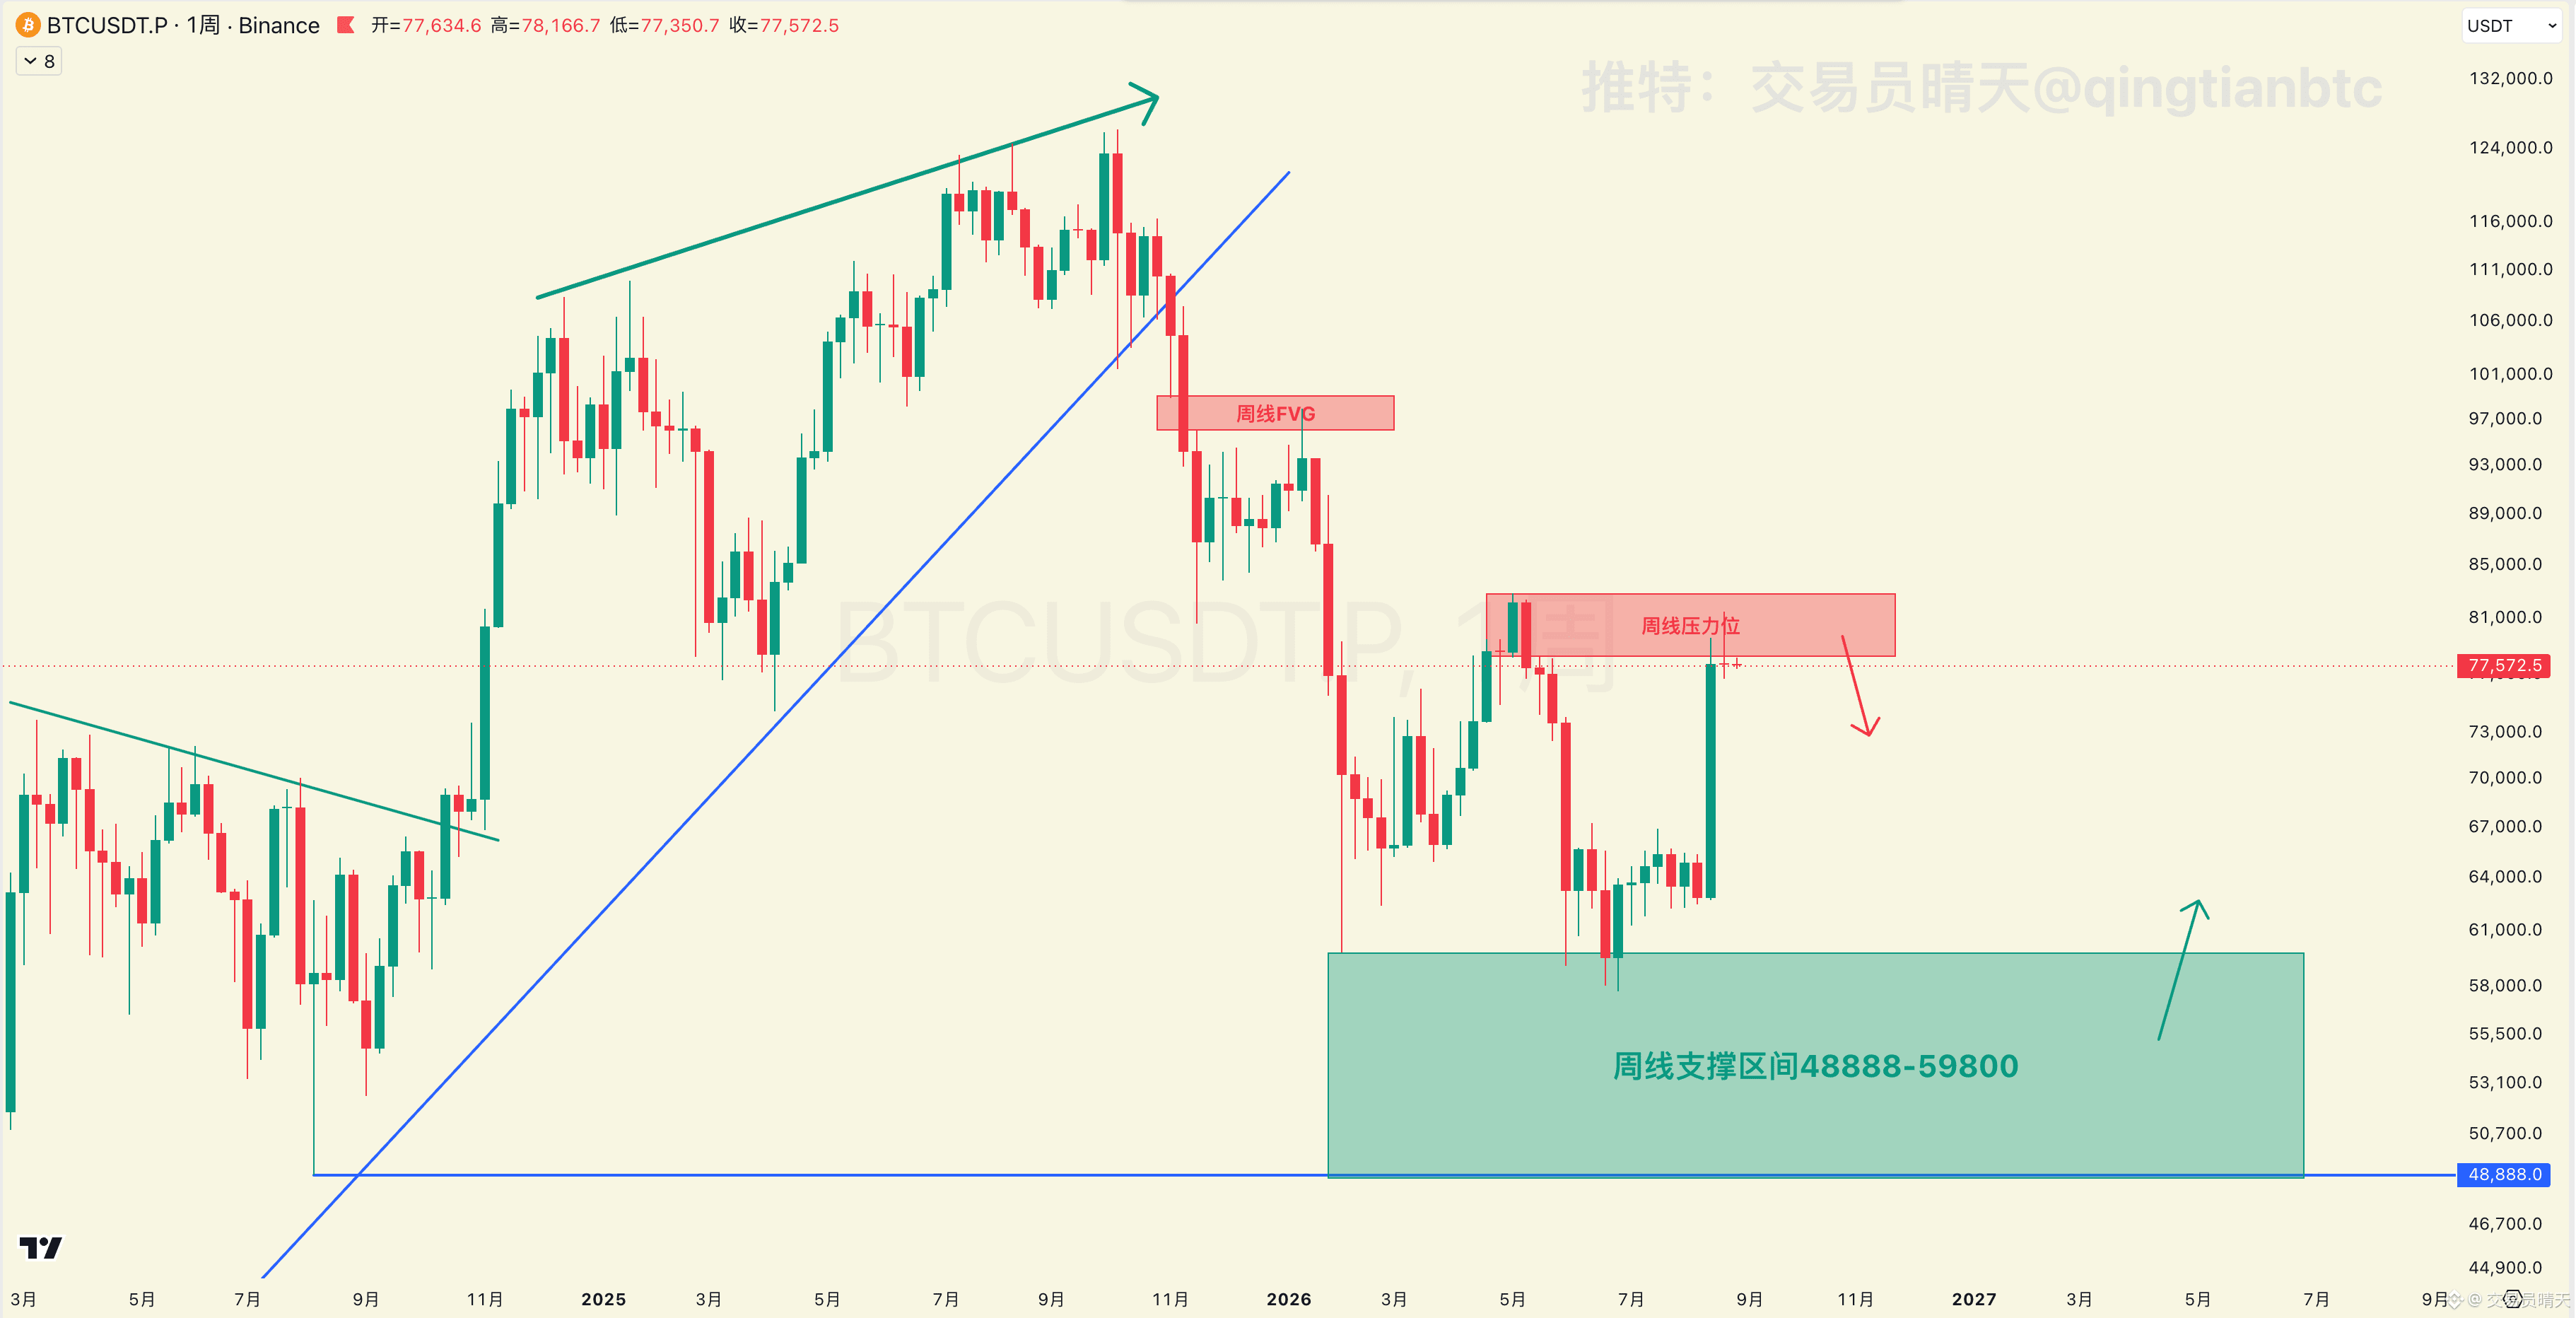
1) Last week stayed at the high level for a whole week. The base-position chips had profit-taking that escaped, so there was no strong breakout to open up space above.
2) The weekly resistance zone is 78,200–82,900. This area previously saw a massive drop of 24,000 dollars. Now it is being touched for the first time, so there is certainly lingering selling pressure.
【Daily (Daily Chart) Level】
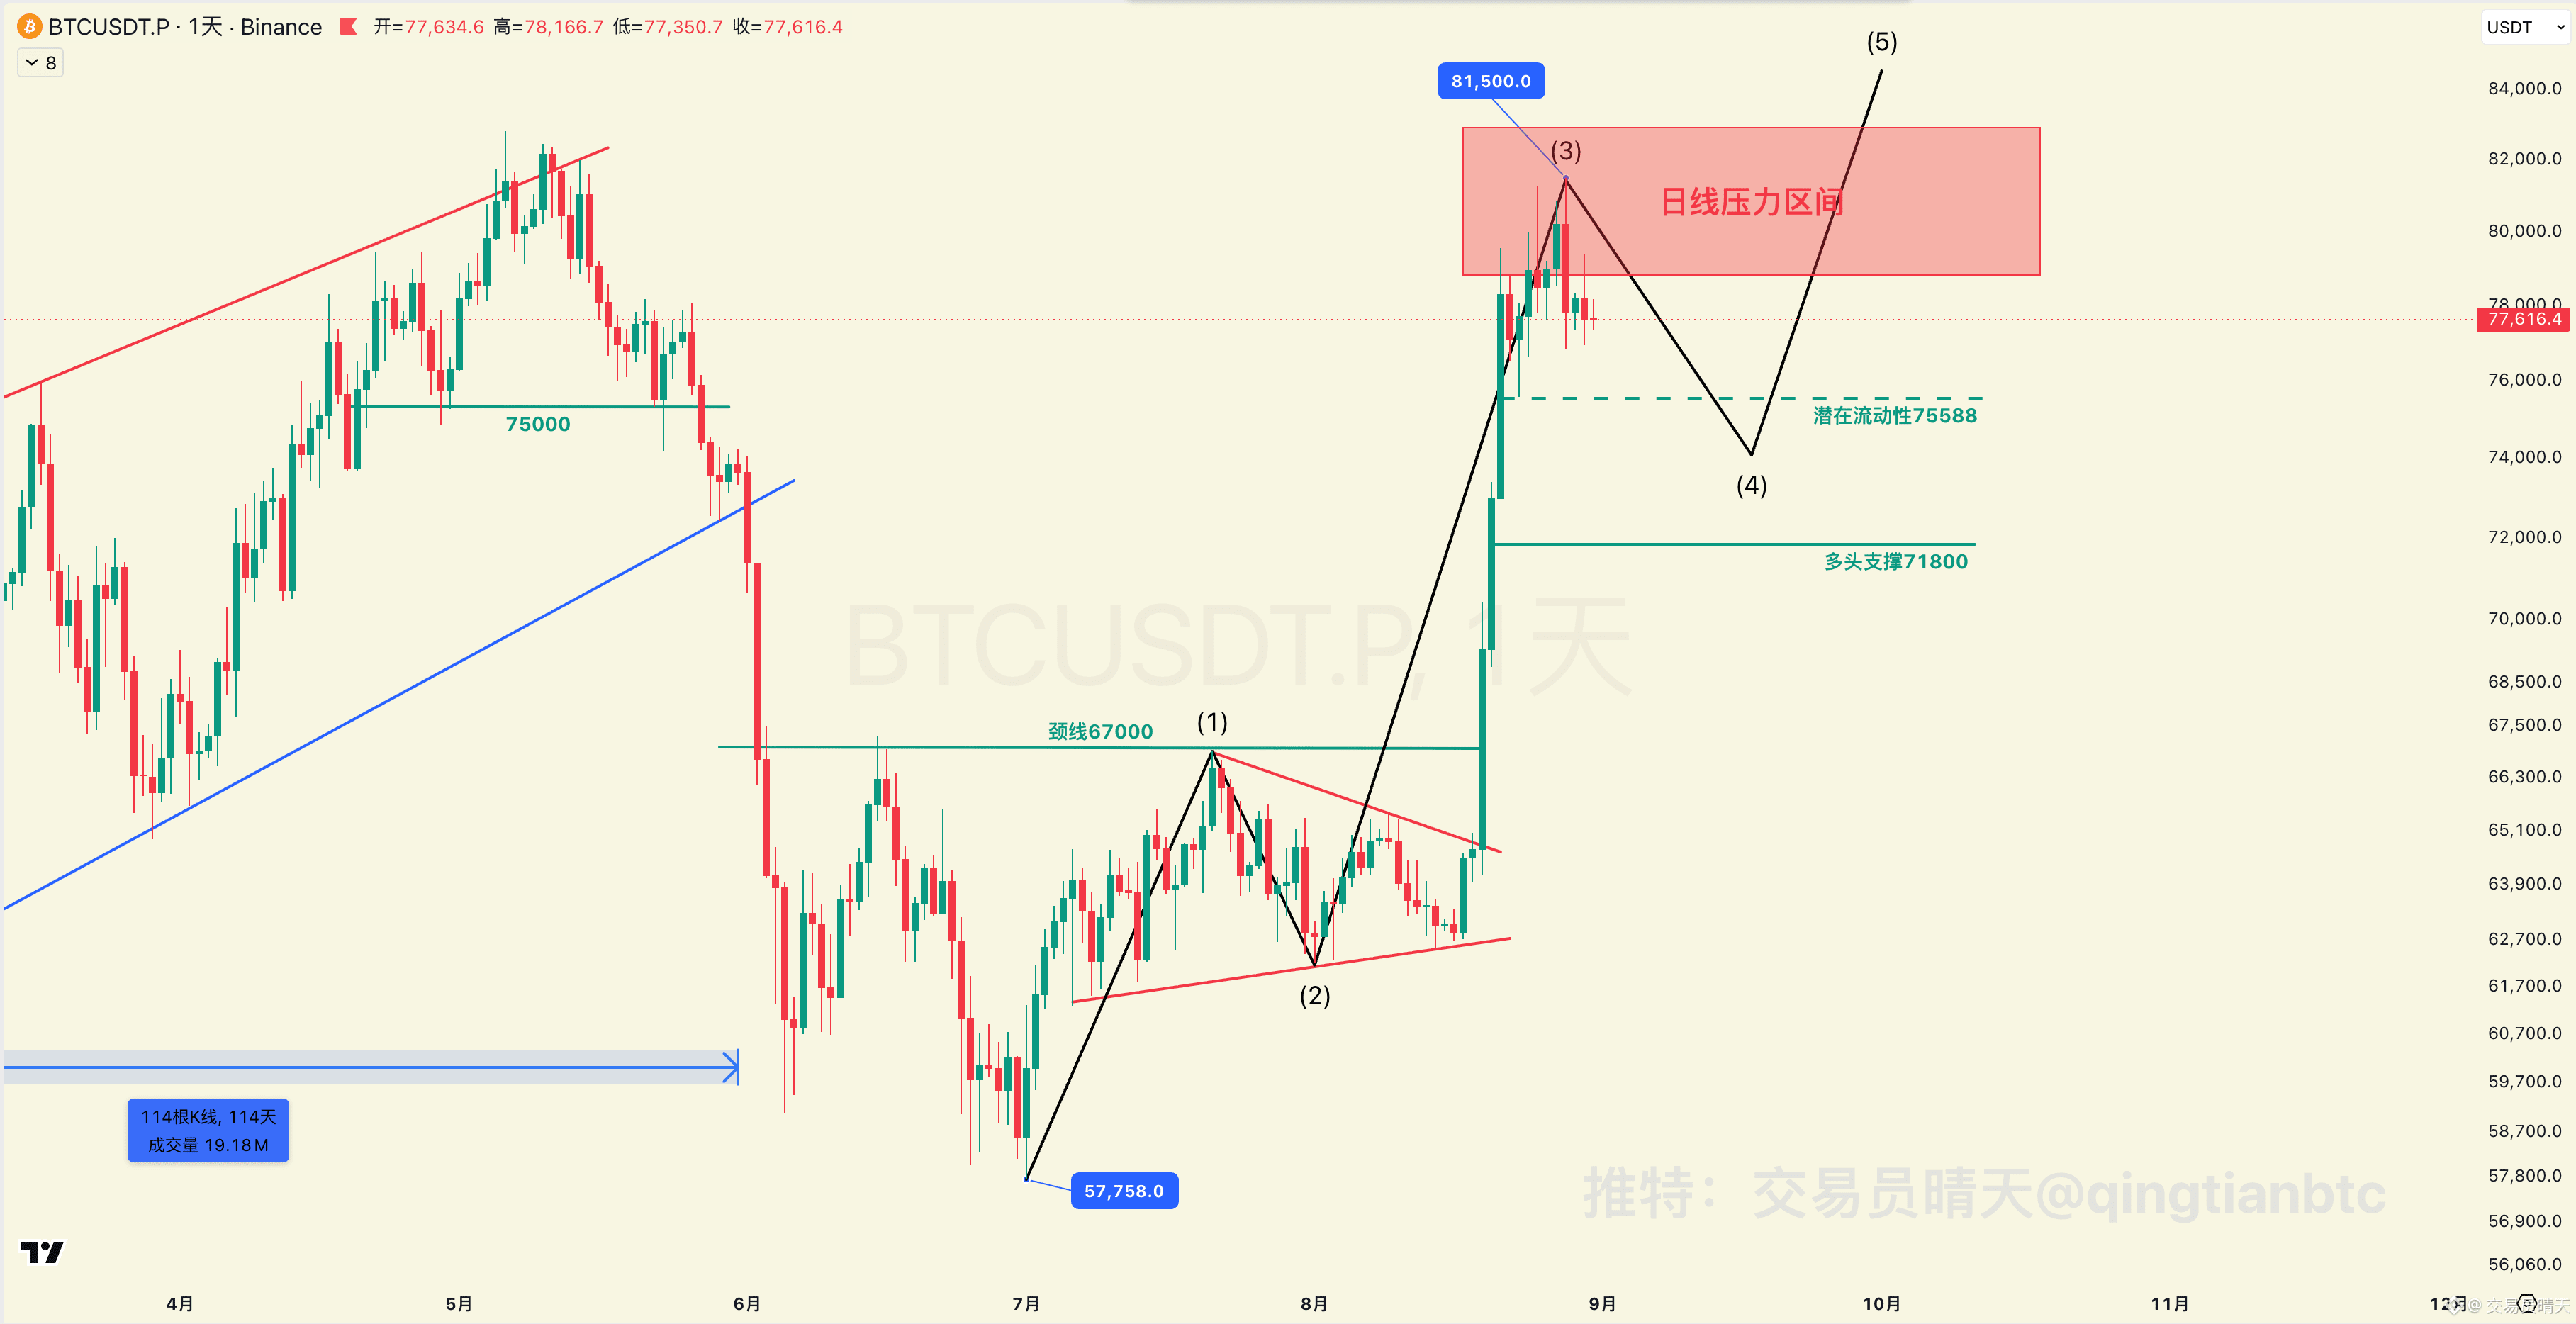
1) The daily resistance range given last week (78,800–82,900) was hit 4 times, but it still didn’t break through. This resistance overlaps with the weekly level, so the pressure is significant.
2) The uptrend starting from 57,758 has moved in three legs. There is a chance it could form a fifth leg. Treat the drop from 81,500 as a pullback. If the pullback revisits 75,588–71,800, price may rise again 📈
【4-Hour (4H Chart) Level】
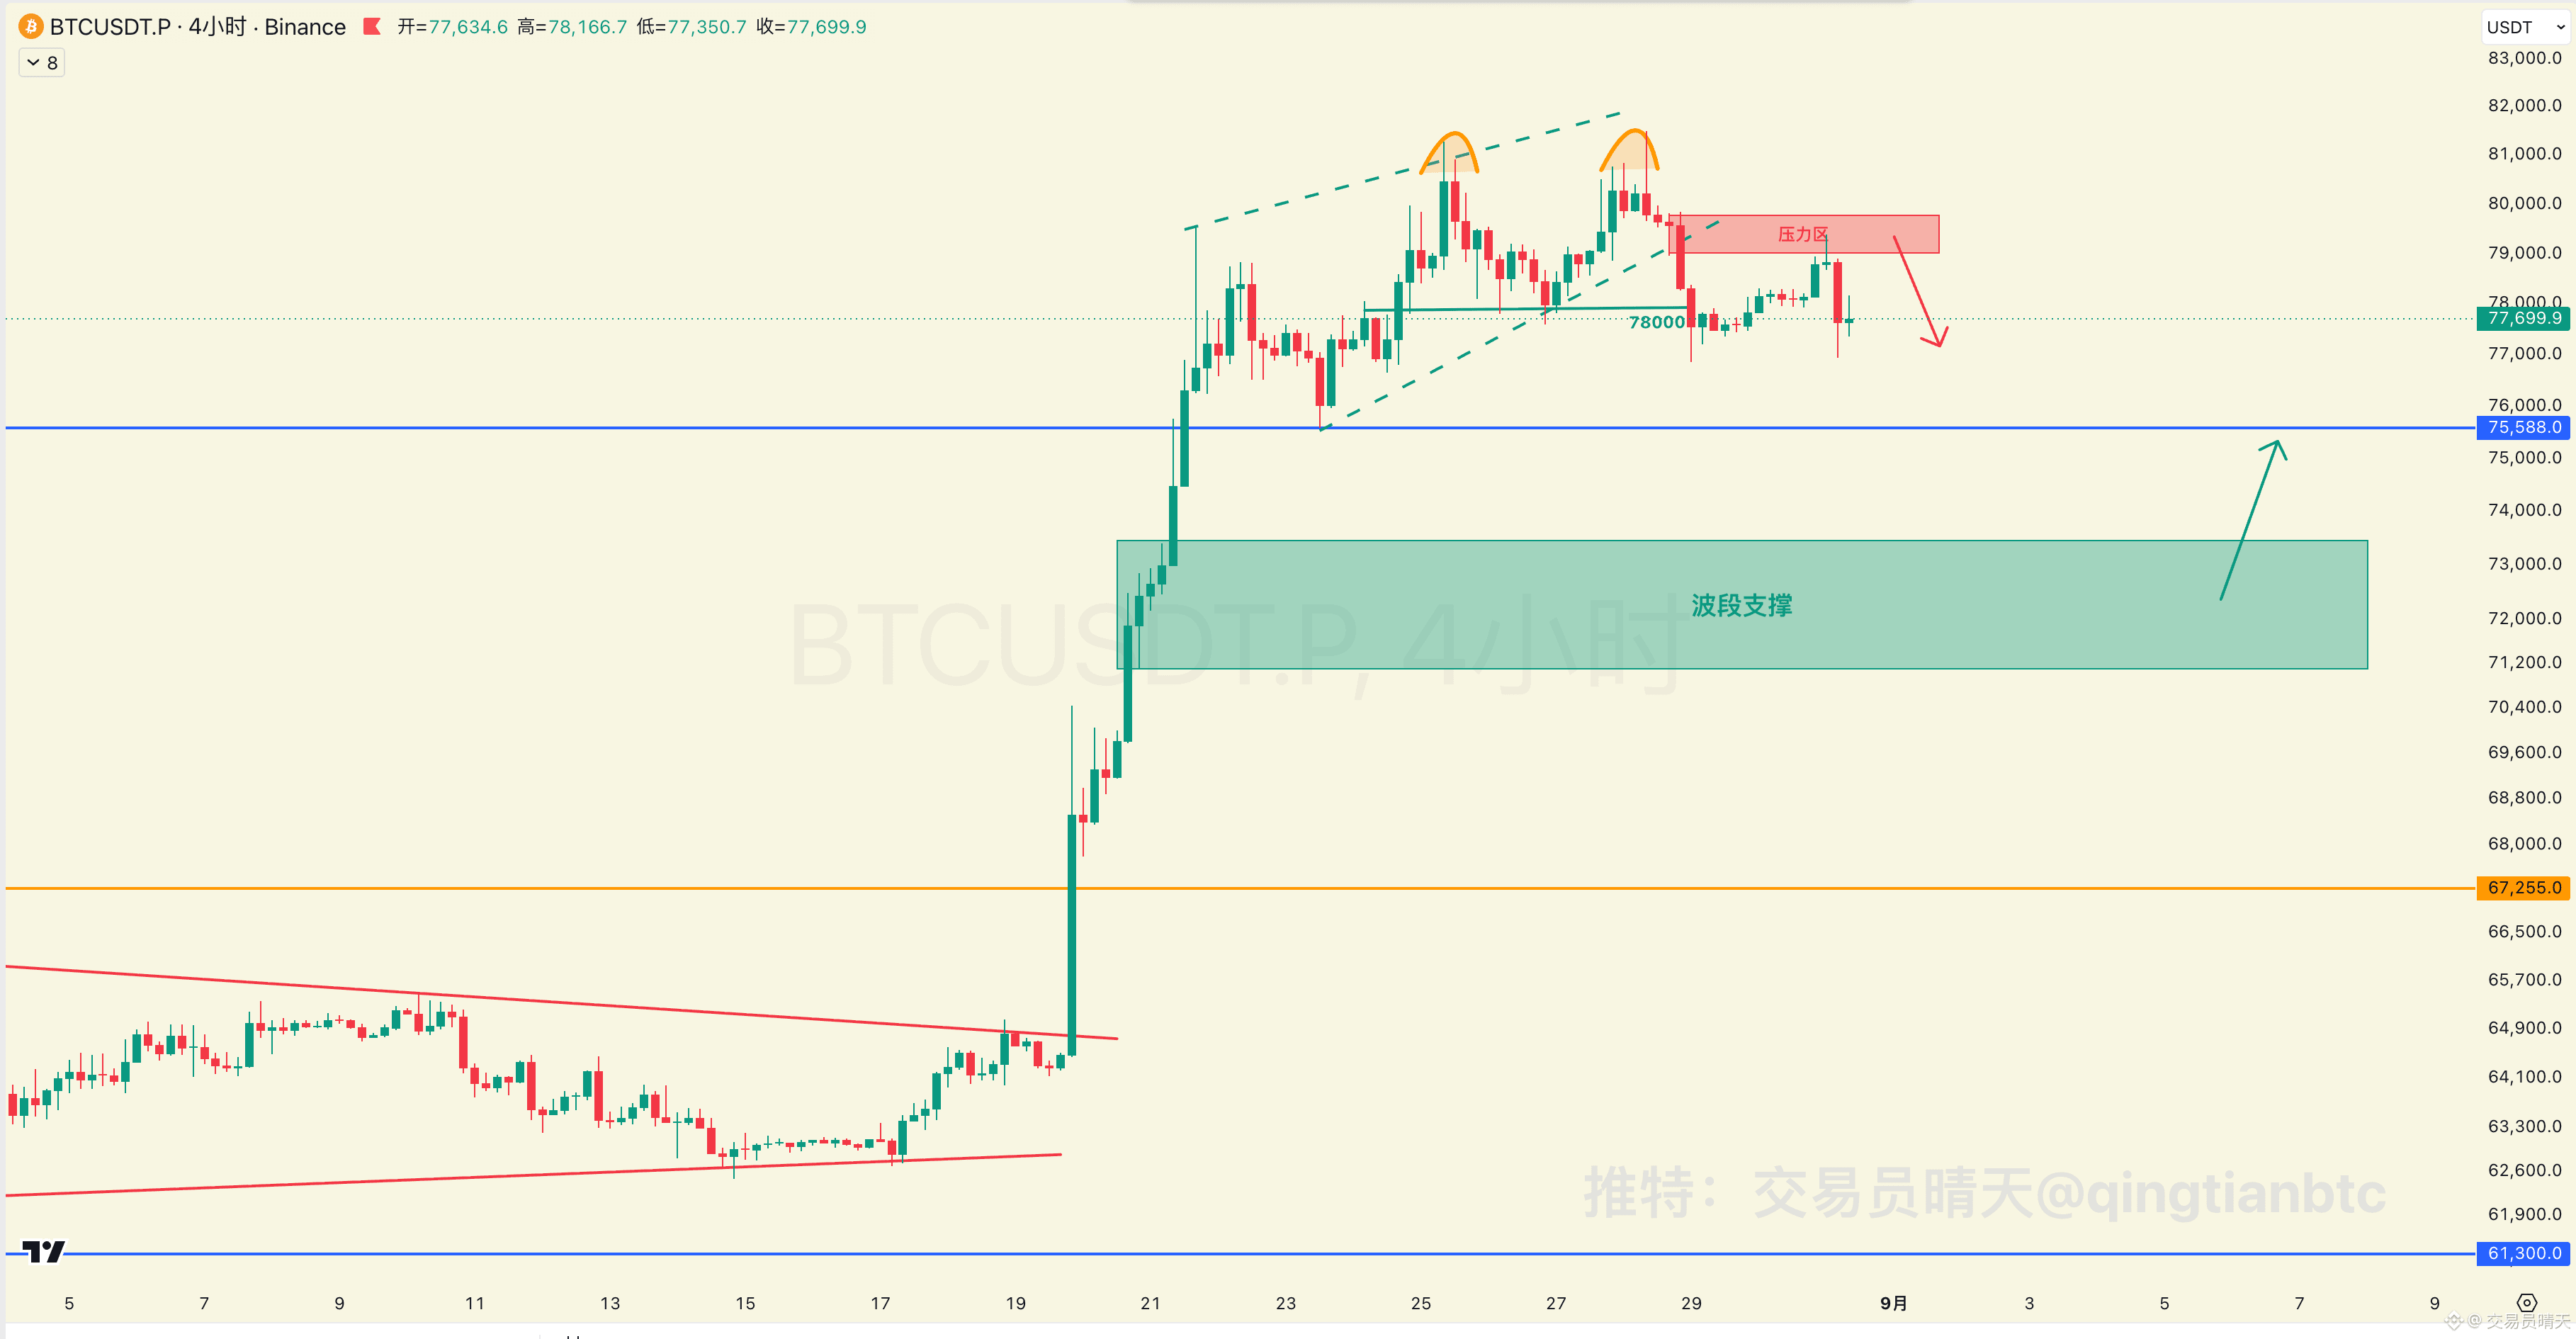
1) The 4-hour level can be seen as a breakdown from a double top, or alternatively a breakdown from a falling wedge. These two patterns will keep exerting pressure and may push the price below 75,588.
2) Resistance zone: 79,000–80,000. Price must not break through here; after a breakout, the situation will need further analysis.
【Weekly (Weekly Chart) Level】
1) Last week stayed at the high level for a whole week. The base-position chips had profit-taking that escaped, so there was no strong breakout to open up space above.
2) The weekly resistance zone is 78,200–82,900. This area previously saw a massive drop of 24,000 dollars. Now it is being touched for the first time, so there is certainly lingering selling pressure.
【Daily (Daily Chart) Level】
1) The daily resistance range given last week (78,800–82,900) was hit 4 times, but it still didn’t break through. This resistance overlaps with the weekly level, so the pressure is significant.
2) The uptrend starting from 57,758 has moved in three legs. There is a chance it could form a fifth leg. Treat the drop from 81,500 as a pullback. If the pullback revisits 75,588–71,800, price may rise again 📈
【4-Hour (4H Chart) Level】
1) The 4-hour level can be seen as a breakdown from a double top, or alternatively a breakdown from a falling wedge. These two patterns will keep exerting pressure and may push the price below 75,588.
2) Resistance zone: 79,000–80,000. Price must not break through here; after a breakout, the situation will need further analysis.