
$BTC JUST GOT HIT WITH A BRUTAL DUMP — BUT THE BATTLE IS NOT OVER!
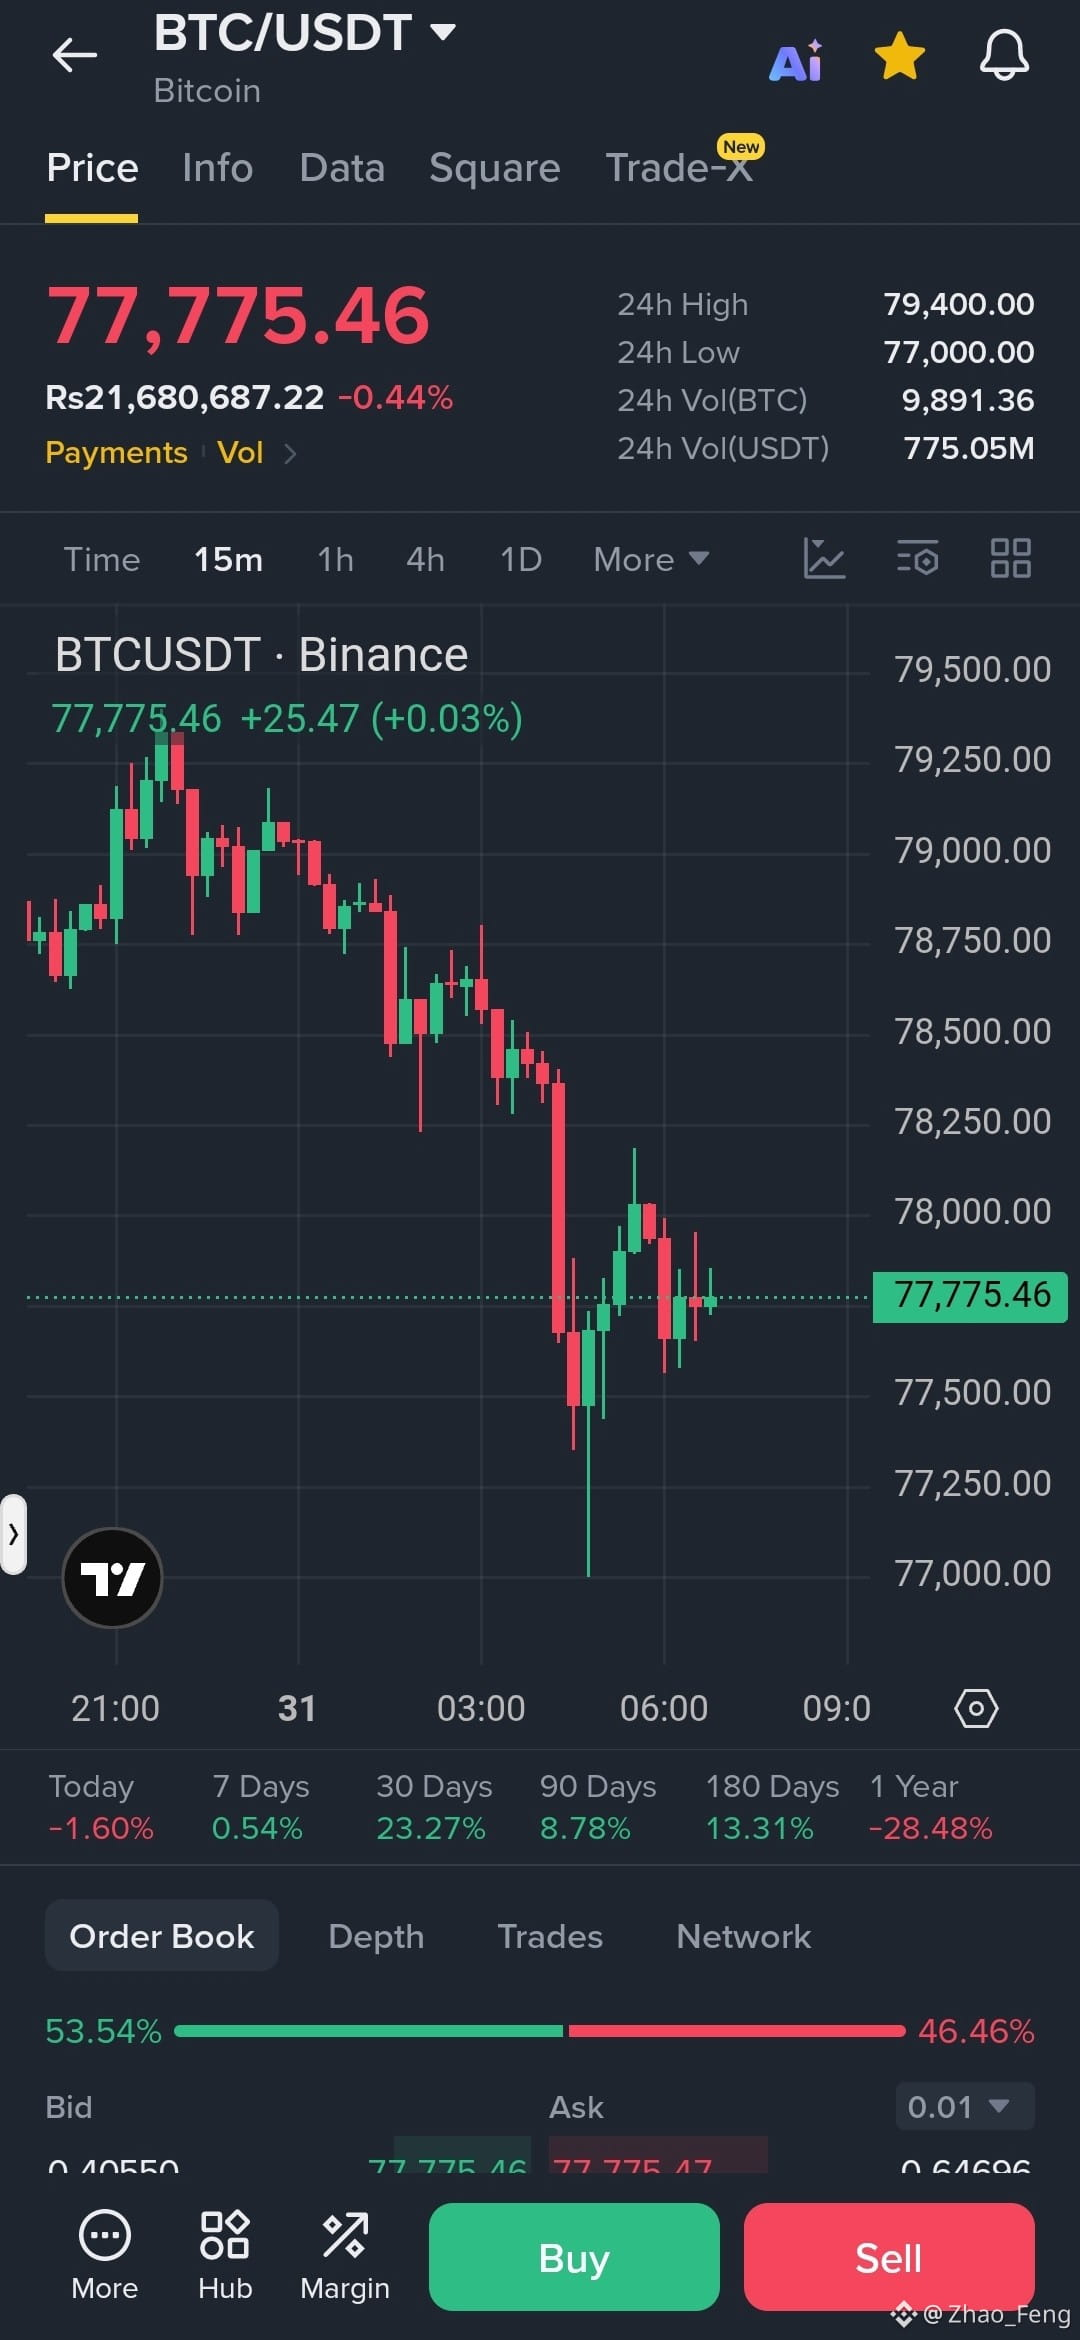
Bitcoin has suddenly turned volatile after getting rejected from the $79,393 resistance zone. The chart shows a strong bullish push that failed to hold, followed by aggressive selling pressure that dragged price all the way toward $77,019.
That massive downside move tells us one thing: sellers are currently in control. However, the long reaction from the lows also shows that buyers are not completely out of the game yet.
$BTC 1H MARKET STRUCTURE
Major High: $79,393
Current Price: Around $77,741
Critical Low: $77,019
Immediate Resistance: $77,800–$78,000
Major Resistance: $79,000–$79,393
The key question now is whether this bounce is a genuine recovery or simply a temporary relief bounce before another leg down.
After such a sharp liquidation candle, price often attempts to recover toward nearby resistance. If BTC fails to reclaim those levels and starts printing fresh bearish rejection, sellers could step back in aggressively.
⚡ $BTC TRADE IDEA
Bias: Bearish below major resistance
Entry Zone: $77,800–$78,200 on rejection
TP1: $77,400
TP2: $77,019
TP3: Below $77,000 if selling momentum accelerates
SL: Above the local resistance after confirmation
🔥 BULLISH SCENARIO:
If Bitcoin reclaims the recovery zone with strong volume and starts holding above it, the short idea weakens significantly. In that case, chasing shorts would be dangerous.
⚠️ BEARISH SCENARIO:
A weak bounce followed by another rejection could send BTC back toward the $77K liquidity zone. A clean breakdown below the recent low could trigger even more volatility.
Right now, patience is everything. The dump was powerful, but entering blindly after a huge red candle is risky. I would rather wait for the bounce, watch the reaction, and let the market reveal whether buyers actually have enough strength to reclaim control.
$79,393 rejected. $77,019 defended. Now BTC is sitting right in the middle of a major decision zone.
The next confirmed move could be explosive. Eyes on $BTC!
Bitcoin has suddenly turned volatile after getting rejected from the $79,393 resistance zone. The chart shows a strong bullish push that failed to hold, followed by aggressive selling pressure that dragged price all the way toward $77,019.
That massive downside move tells us one thing: sellers are currently in control. However, the long reaction from the lows also shows that buyers are not completely out of the game yet.
$BTC 1H MARKET STRUCTURE
Major High: $79,393
Current Price: Around $77,741
Critical Low: $77,019
Immediate Resistance: $77,800–$78,000
Major Resistance: $79,000–$79,393
The key question now is whether this bounce is a genuine recovery or simply a temporary relief bounce before another leg down.
After such a sharp liquidation candle, price often attempts to recover toward nearby resistance. If BTC fails to reclaim those levels and starts printing fresh bearish rejection, sellers could step back in aggressively.
⚡ $BTC TRADE IDEA
Bias: Bearish below major resistance
Entry Zone: $77,800–$78,200 on rejection
TP1: $77,400
TP2: $77,019
TP3: Below $77,000 if selling momentum accelerates
SL: Above the local resistance after confirmation
🔥 BULLISH SCENARIO:
If Bitcoin reclaims the recovery zone with strong volume and starts holding above it, the short idea weakens significantly. In that case, chasing shorts would be dangerous.
⚠️ BEARISH SCENARIO:
A weak bounce followed by another rejection could send BTC back toward the $77K liquidity zone. A clean breakdown below the recent low could trigger even more volatility.
Right now, patience is everything. The dump was powerful, but entering blindly after a huge red candle is risky. I would rather wait for the bounce, watch the reaction, and let the market reveal whether buyers actually have enough strength to reclaim control.
$79,393 rejected. $77,019 defended. Now BTC is sitting right in the middle of a major decision zone.
The next confirmed move could be explosive. Eyes on $BTC!