Trading Thesis|8/31 08:21
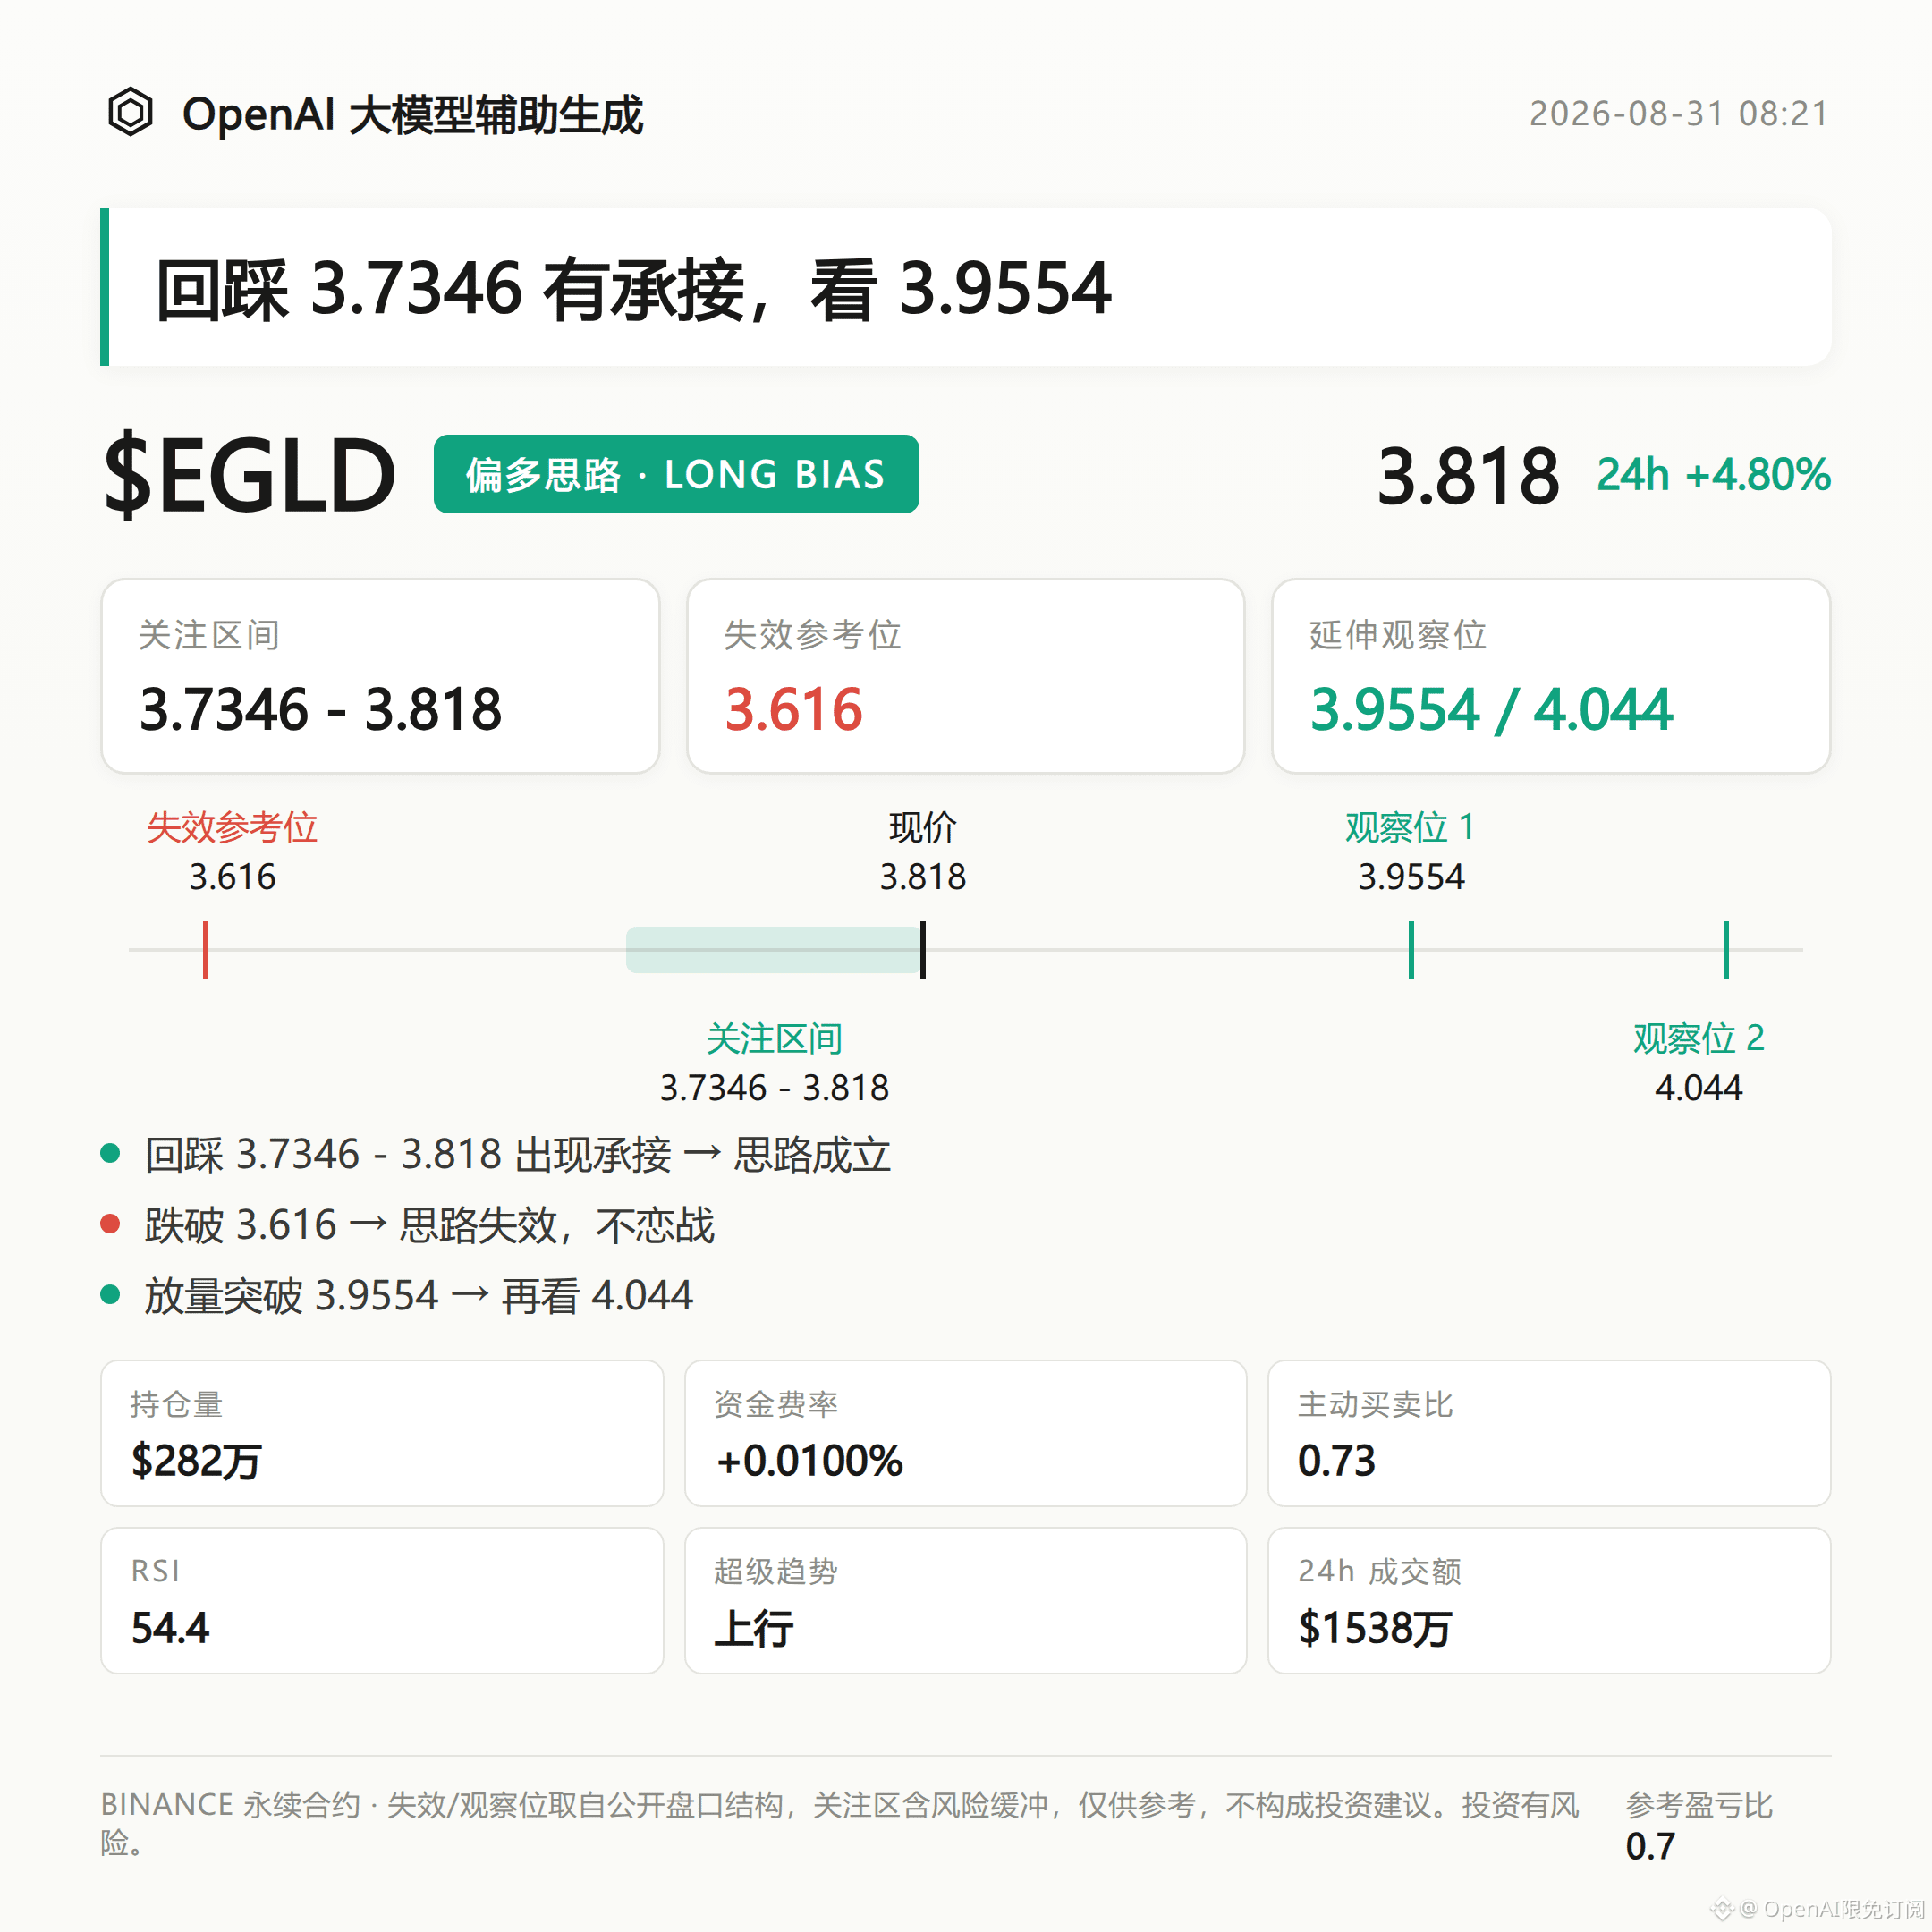
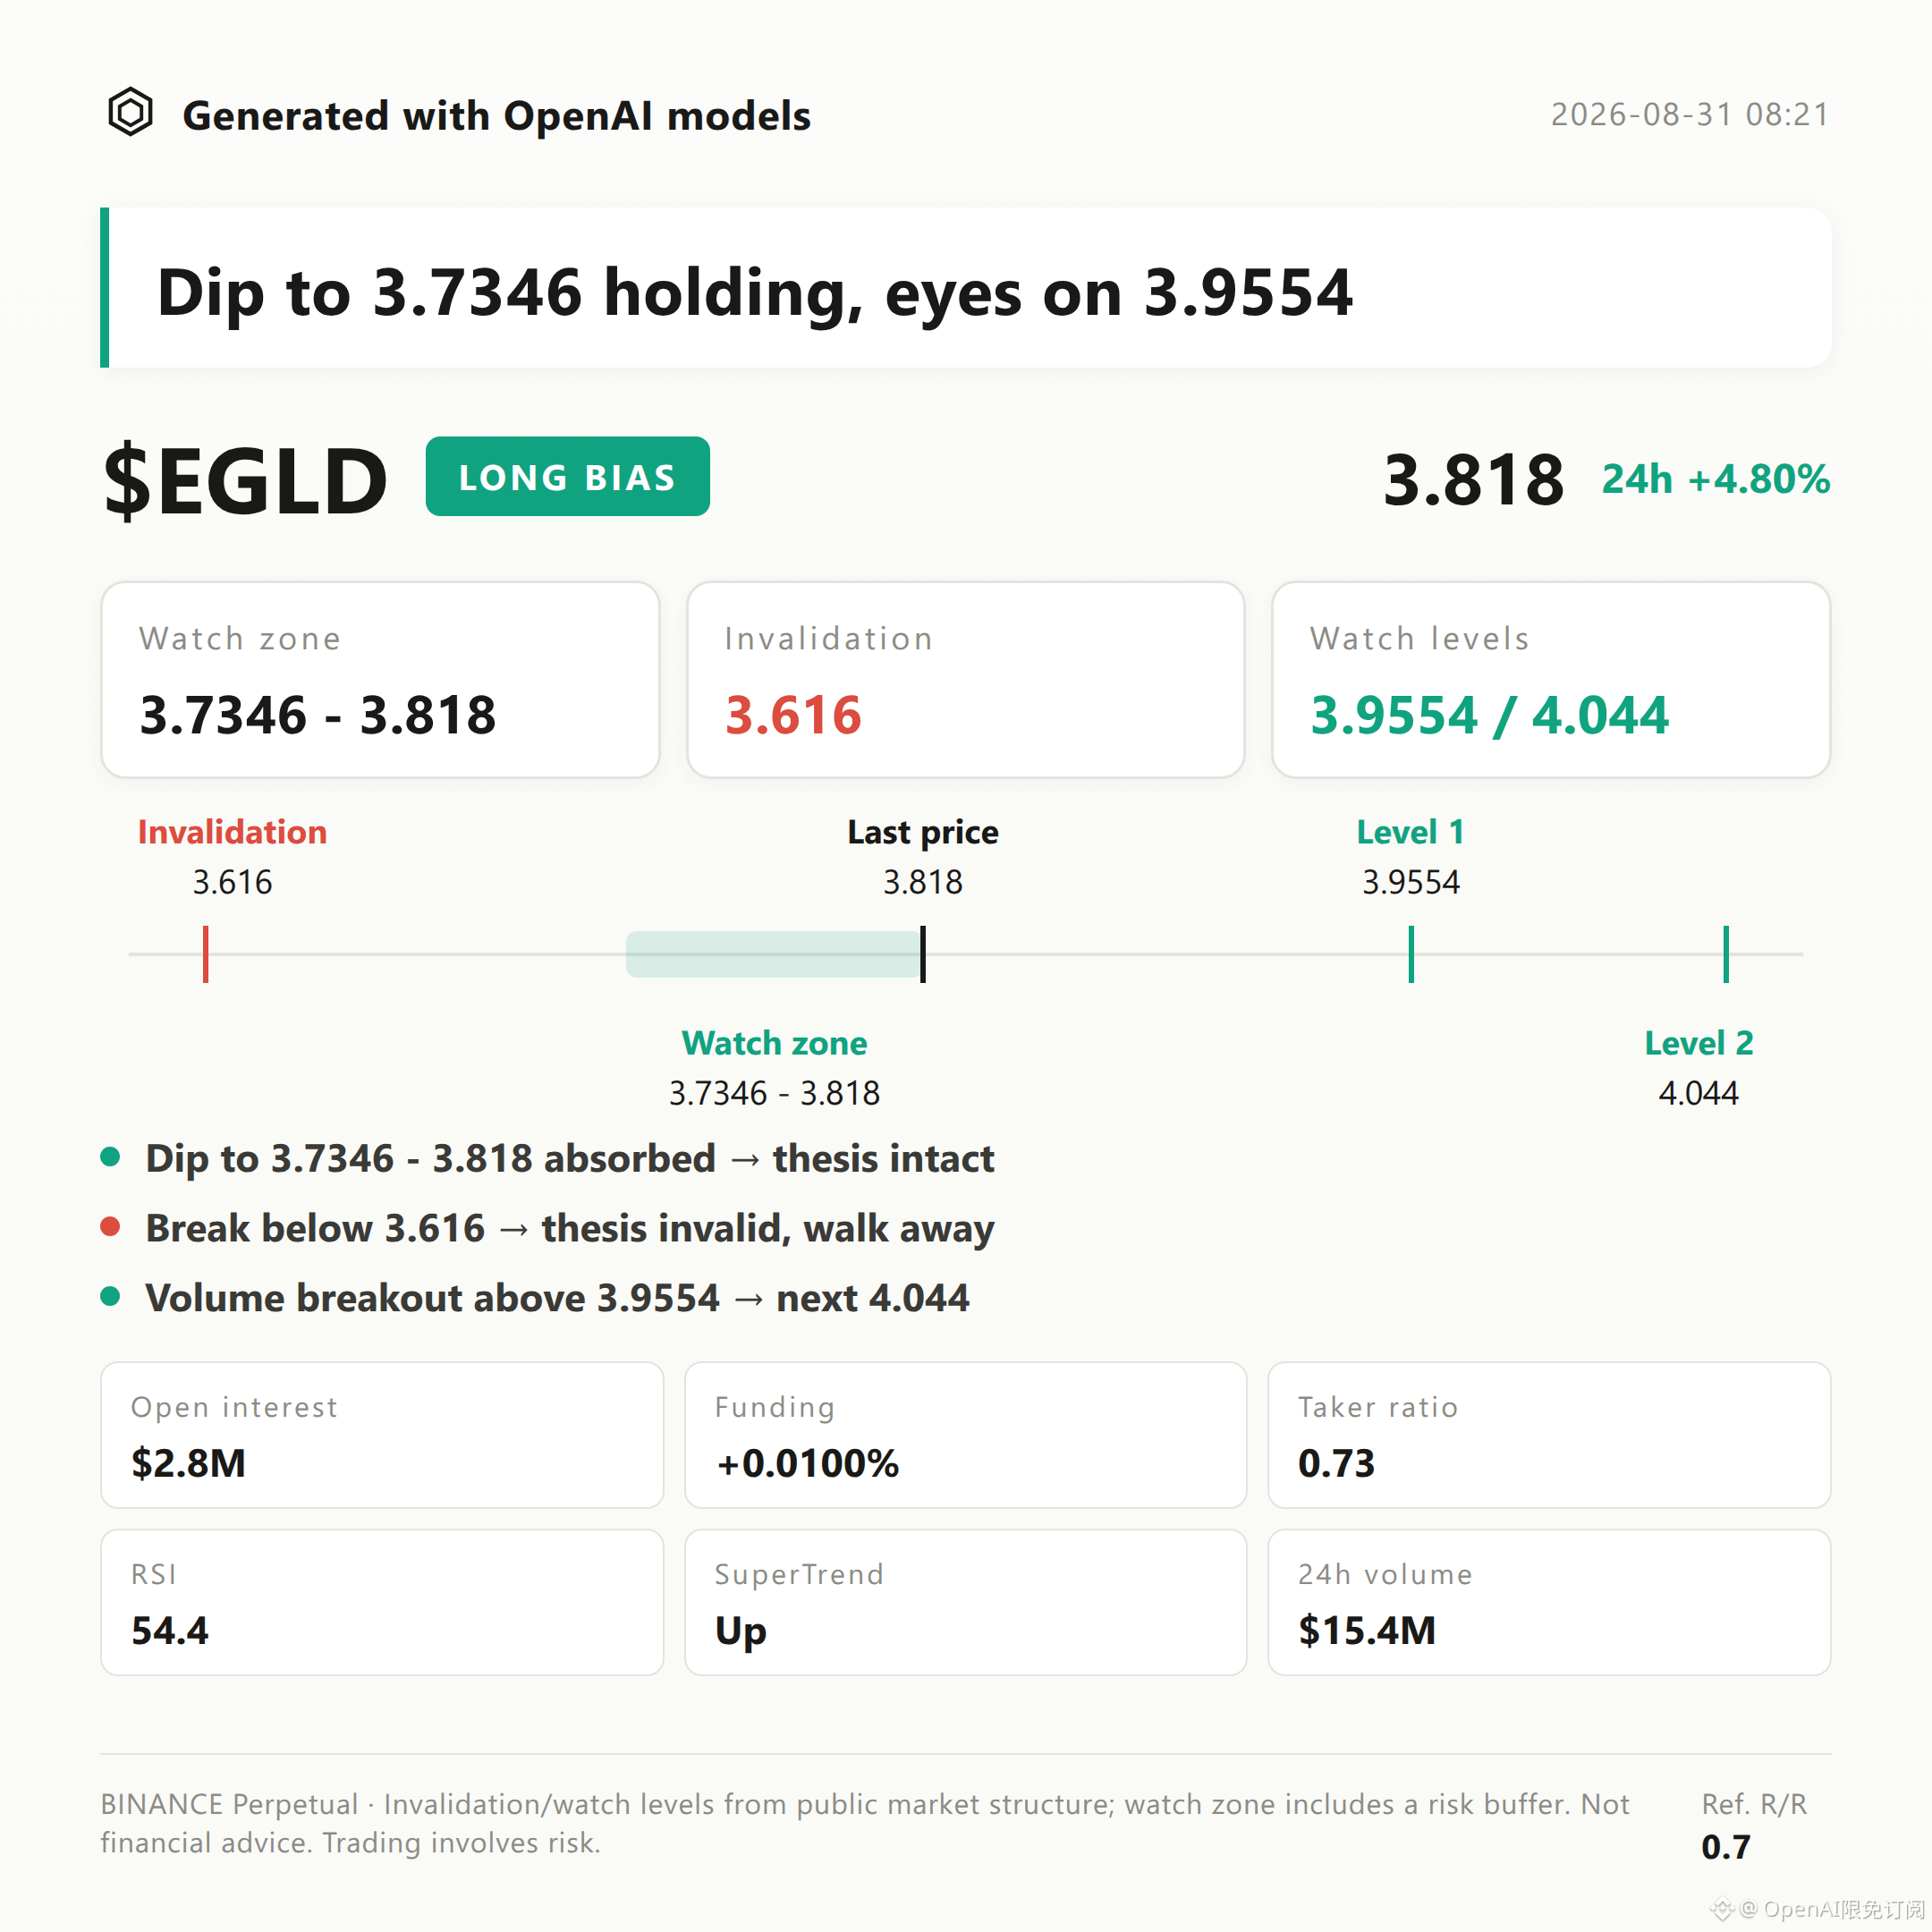
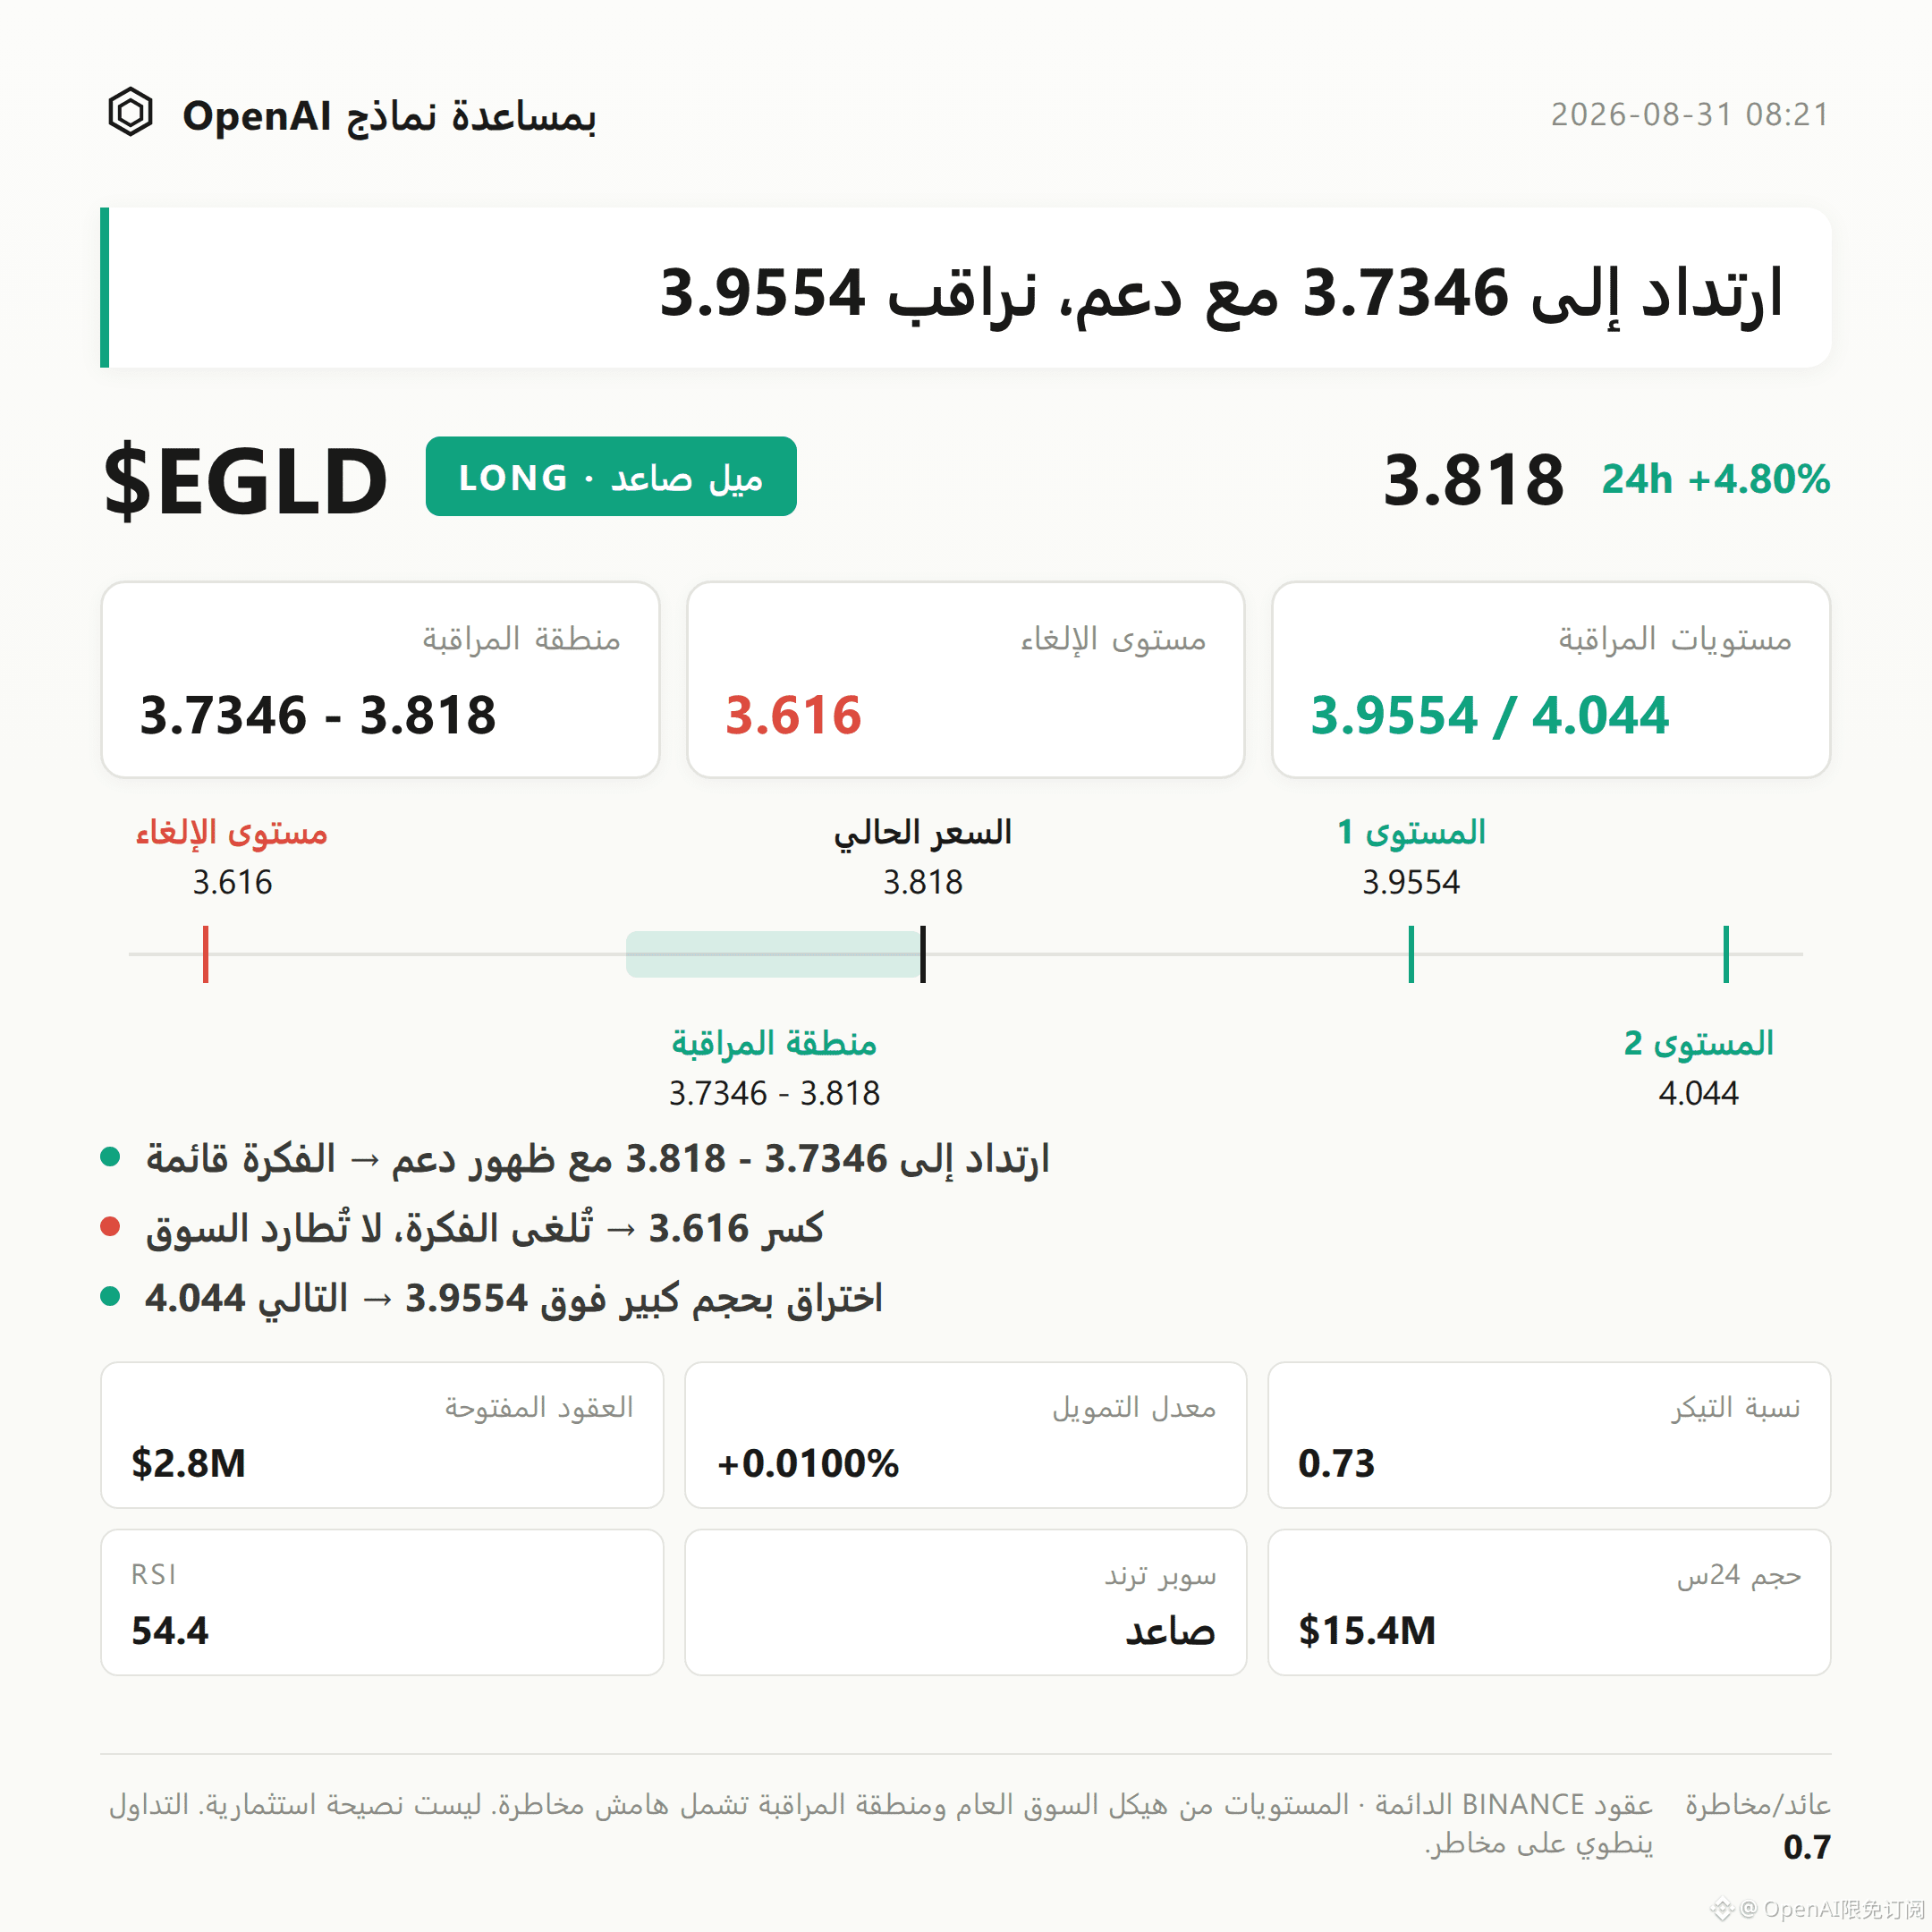
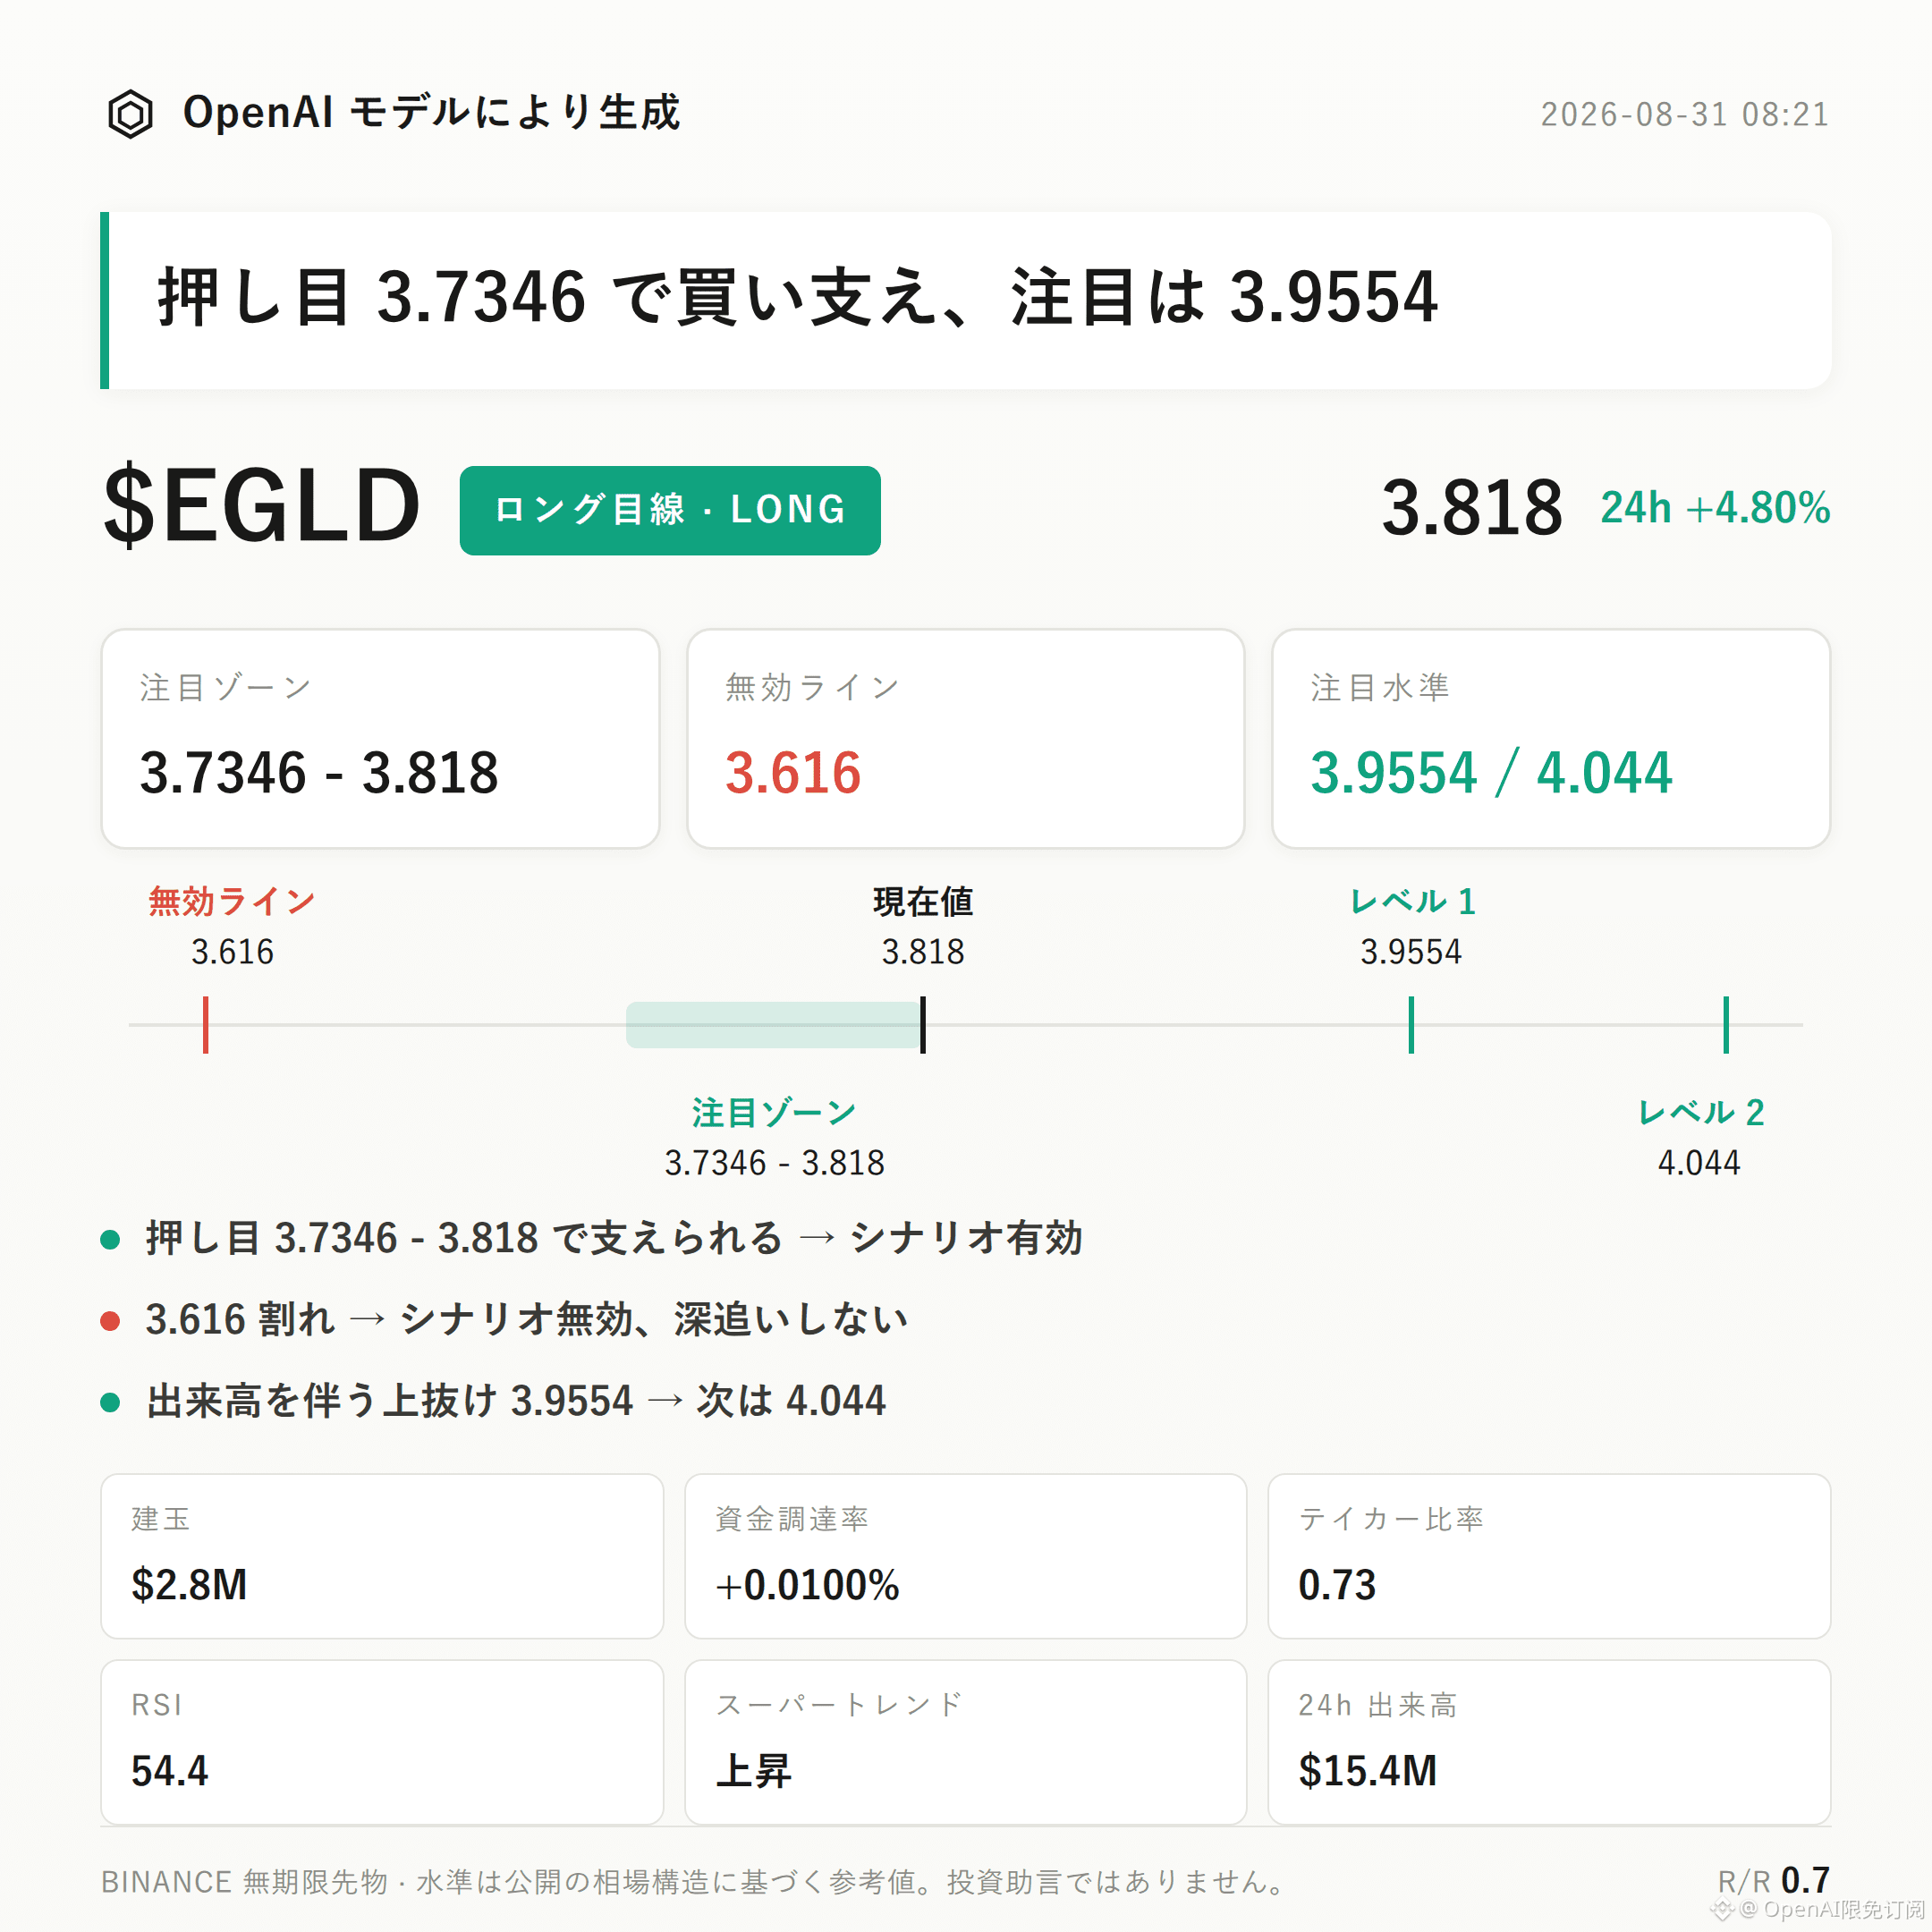
$EGLD bullish-leaning approach | Watch Zone 3.7346 - 3.818 | Invalidation Reference 3.616 | Observation Levels 3.9554 / 4.044
$EGLD ’s current structure is bullish.
Core points: the Supertrend remains upward, MACD maintains bullish momentum, and the open interest increased by 10.0% over the past 24 hours; volume and price are expanding in sync.
Next, focus on whether the bullish zone can continue to receive support during pullbacks—this serves as a way to verify whether the thesis remains valid.
As of 08:20 (Beijing time) on Aug 31, $EGLD current price is 3.818, with a 24-hour gain of +4.80%.
From a technical structure perspective, price is trading in the upper half between the recent low of 3.616 and the recent high of 4.044. The Bollinger midline is 3.845 and the upper band is 3.9554; the current price is close to just below the midline and has not yet tested upper-band resistance.
The Supertrend indicator shows an upward state. MACD shows bullish momentum, and RSI is 54.4—sitting in a neutral-to-healthy range, neither overbought nor indicating waning momentum.
Derivatives-wise, it is also bullish.
The past 24-hour trading value is about $15.38 million, and open interest is about $2.82 million with a +10.0% increase over 24 hours, indicating that new positions are entering in the direction of the price advance.
Funding rate is +0.0100%, meaning the long side pays moderately; there are no signs of overheating yet. The long-to-short account ratio shows longs at 60%, suggesting a bullish sentiment.
However, it’s important to state this accurately: the aggressive buy/sell ratio is 0.73, which indicates that the order book’s aggressive sell pressure is currently stronger than aggressive buy pressure. Also, the volume expansion is not fully synchronized with aggressive buying—this is the most important contrary evidence for this thesis at present.
For the reference levels, you can track them as follows.
For the bullish zone, first watch 3.7346 to 3.818. It’s better to wait for price to pull back into this range and see signs of support before confirming, rather than assuming the structure is valid at the current price.
If price breaks below 3.616, it would indicate that the current upward setup is broken; the bullish thesis should be treated as invalid and should not be applied further.
If price continues higher with expanding volume and breaks above the 3.9554 observation level, you can then watch how price behaves around 4.044 for clues on whether the structure opens up further.
It should be emphasized that the reference risk-reward ratio is 0.7, which is relatively low. Combined with the counter-signal that the aggressive buy/sell ratio is not dominant, the certainty of this thesis is limited—it is not yet fully confirmed that the trend is solid.
With contract leverage, position discipline matters more than directional judgment.
Live disclosure: this account currently holds a long position of $FOGO . Structurally, I continue to look for upside; the viewpoint is consistent with the position.
For reference only and does not constitute investment advice. Contracts involve leverage, and investing carries risk.
This article is generated with assistance from an OpenAI large model.
$EGLD
#Contract Analysis
$EGLD bullish-leaning approach | Watch Zone 3.7346 - 3.818 | Invalidation Reference 3.616 | Observation Levels 3.9554 / 4.044
$EGLD ’s current structure is bullish.
Core points: the Supertrend remains upward, MACD maintains bullish momentum, and the open interest increased by 10.0% over the past 24 hours; volume and price are expanding in sync.
Next, focus on whether the bullish zone can continue to receive support during pullbacks—this serves as a way to verify whether the thesis remains valid.
As of 08:20 (Beijing time) on Aug 31, $EGLD current price is 3.818, with a 24-hour gain of +4.80%.
From a technical structure perspective, price is trading in the upper half between the recent low of 3.616 and the recent high of 4.044. The Bollinger midline is 3.845 and the upper band is 3.9554; the current price is close to just below the midline and has not yet tested upper-band resistance.
The Supertrend indicator shows an upward state. MACD shows bullish momentum, and RSI is 54.4—sitting in a neutral-to-healthy range, neither overbought nor indicating waning momentum.
Derivatives-wise, it is also bullish.
The past 24-hour trading value is about $15.38 million, and open interest is about $2.82 million with a +10.0% increase over 24 hours, indicating that new positions are entering in the direction of the price advance.
Funding rate is +0.0100%, meaning the long side pays moderately; there are no signs of overheating yet. The long-to-short account ratio shows longs at 60%, suggesting a bullish sentiment.
However, it’s important to state this accurately: the aggressive buy/sell ratio is 0.73, which indicates that the order book’s aggressive sell pressure is currently stronger than aggressive buy pressure. Also, the volume expansion is not fully synchronized with aggressive buying—this is the most important contrary evidence for this thesis at present.
For the reference levels, you can track them as follows.
For the bullish zone, first watch 3.7346 to 3.818. It’s better to wait for price to pull back into this range and see signs of support before confirming, rather than assuming the structure is valid at the current price.
If price breaks below 3.616, it would indicate that the current upward setup is broken; the bullish thesis should be treated as invalid and should not be applied further.
If price continues higher with expanding volume and breaks above the 3.9554 observation level, you can then watch how price behaves around 4.044 for clues on whether the structure opens up further.
It should be emphasized that the reference risk-reward ratio is 0.7, which is relatively low. Combined with the counter-signal that the aggressive buy/sell ratio is not dominant, the certainty of this thesis is limited—it is not yet fully confirmed that the trend is solid.
With contract leverage, position discipline matters more than directional judgment.
Live disclosure: this account currently holds a long position of $FOGO . Structurally, I continue to look for upside; the viewpoint is consistent with the position.
For reference only and does not constitute investment advice. Contracts involve leverage, and investing carries risk.
This article is generated with assistance from an OpenAI large model.
$EGLD
#Contract Analysis