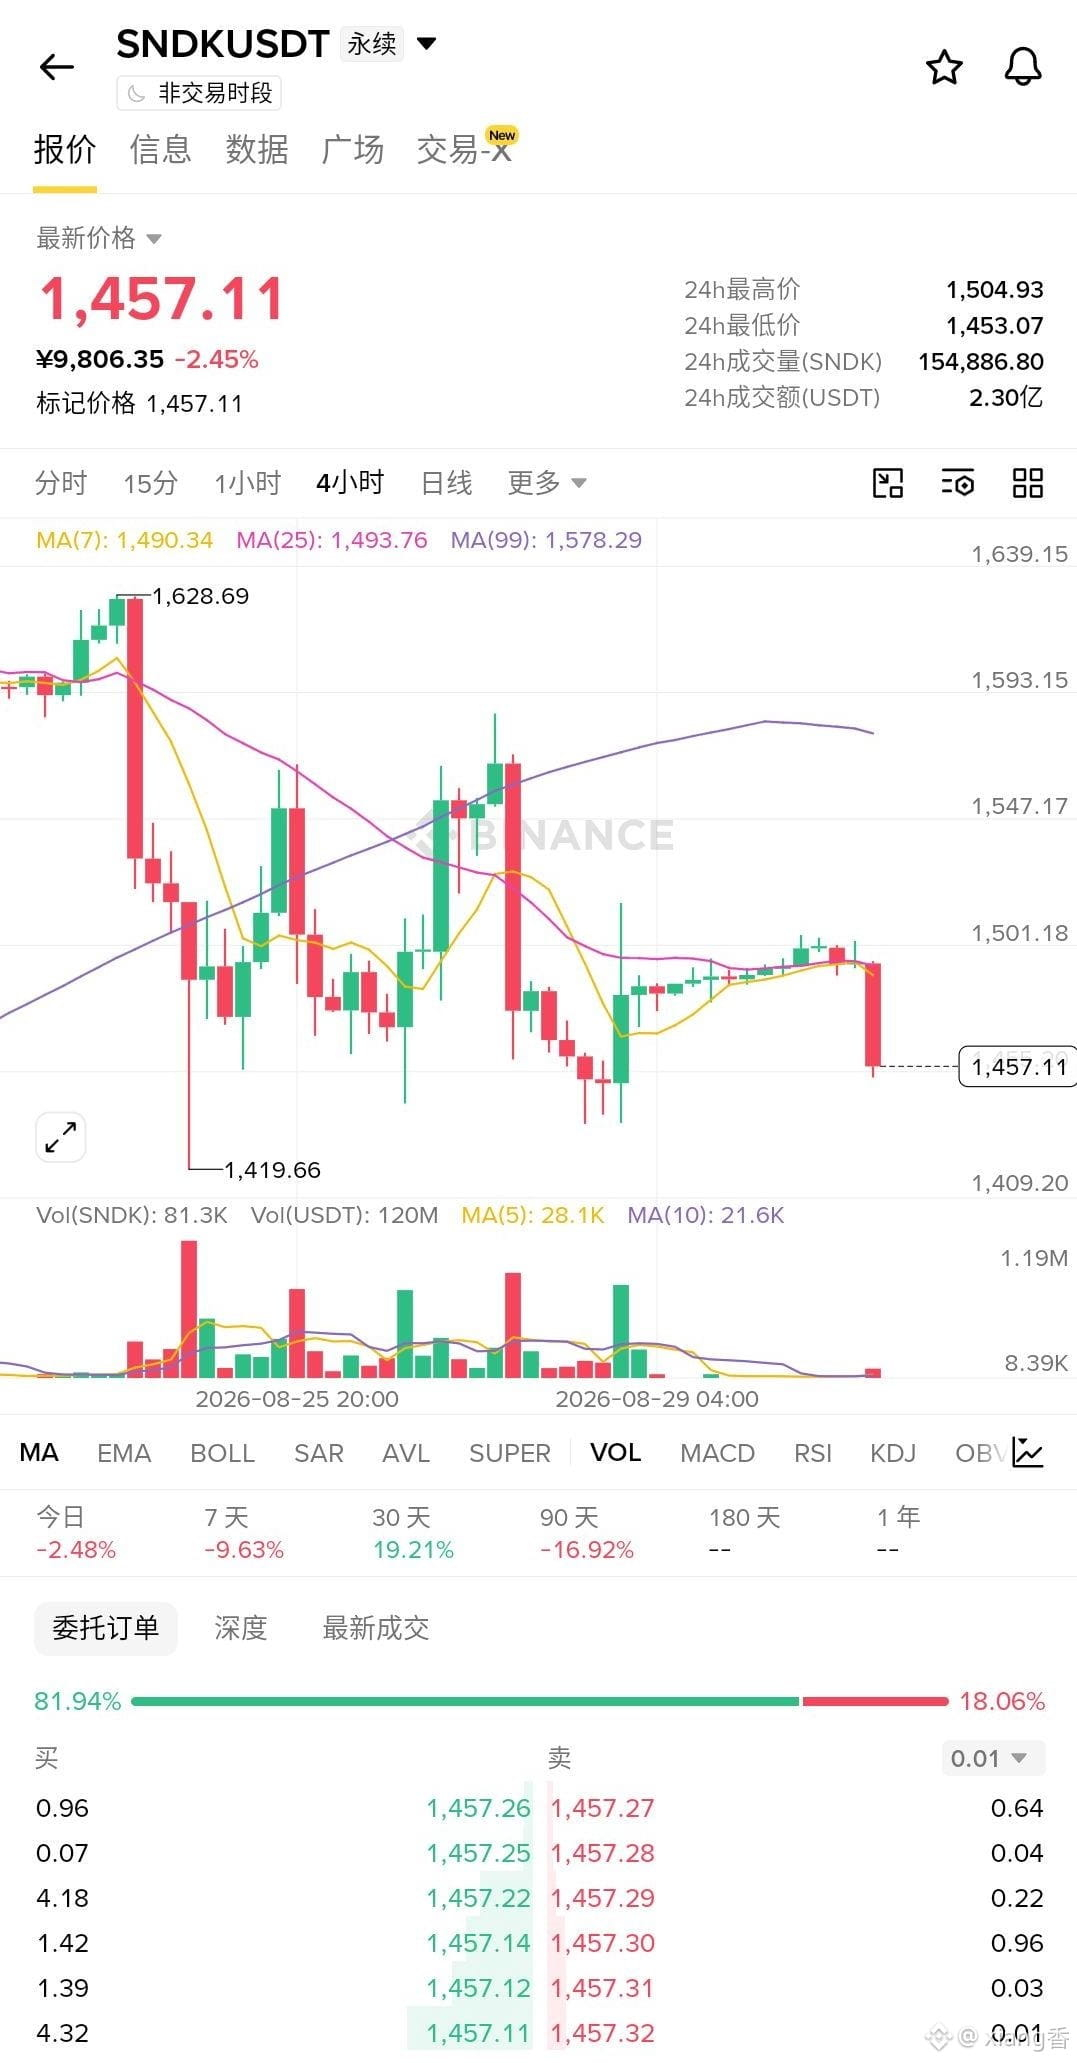
SNDK grind down to 1455, clinging to the 24-hour low at 1453 without daring to lift its head. MA20/MA50 are all pressing down overhead. Both the 4-hour and daily charts are simultaneously judged DOWN. Even so, in the contract account, the long position ratio is still stuck at 71%, and over the past 7 hours it has continued to rise—yet the price doesn’t care, and the longs’ paper profit/loss isn’t dissipating.
First, look at the order book: the spot buy/sell volume ratio is only 0.857, with sell orders pressing down on buy orders. Next, the futures side: over 7 hours, the position value shrank by 3.28%. This time is different from before—not the buildup of “it’s falling but leverage is still being stacked.” Instead, the price is slipping down while leverage is leaking out on both ends.
Fee rate is 0.0%, and longs aren’t getting any blood transfusion at all. Breaking down the big players makes it clearer: the number of long accounts is up 5.49%, but the proportion of genuinely large long positions has actually dropped by 0.31%—more longs are coming from small accounts, while the big capital meant to anchor the ship is quietly reducing. Active trades are 52% buys—at best it’s resistance, not strong enough to support a reversal.
I directly stand on the short side: a crowded long at 71% + breakdown + shrinking leverage means the probability of being squeezed downward is clearly greater than that of breaking upward. If it breaks below 1453, short in line with the move. Targets are 1436 and 1409. Stop-loss at 1486, above MA20.
When would I turn long? If two out of three happen: (1) position volume rises with an increase in volume, (2) price reclaims 1486 and stays above the moving averages, or (3) net inflow from big spot orders turns positive. If two of the three appear, the short thesis is invalid and I’ll flip to follow long.
#sandisk $SNDK
First, look at the order book: the spot buy/sell volume ratio is only 0.857, with sell orders pressing down on buy orders. Next, the futures side: over 7 hours, the position value shrank by 3.28%. This time is different from before—not the buildup of “it’s falling but leverage is still being stacked.” Instead, the price is slipping down while leverage is leaking out on both ends.
Fee rate is 0.0%, and longs aren’t getting any blood transfusion at all. Breaking down the big players makes it clearer: the number of long accounts is up 5.49%, but the proportion of genuinely large long positions has actually dropped by 0.31%—more longs are coming from small accounts, while the big capital meant to anchor the ship is quietly reducing. Active trades are 52% buys—at best it’s resistance, not strong enough to support a reversal.
I directly stand on the short side: a crowded long at 71% + breakdown + shrinking leverage means the probability of being squeezed downward is clearly greater than that of breaking upward. If it breaks below 1453, short in line with the move. Targets are 1436 and 1409. Stop-loss at 1486, above MA20.
When would I turn long? If two out of three happen: (1) position volume rises with an increase in volume, (2) price reclaims 1486 and stays above the moving averages, or (3) net inflow from big spot orders turns positive. If two of the three appear, the short thesis is invalid and I’ll flip to follow long.
#sandisk $SNDK