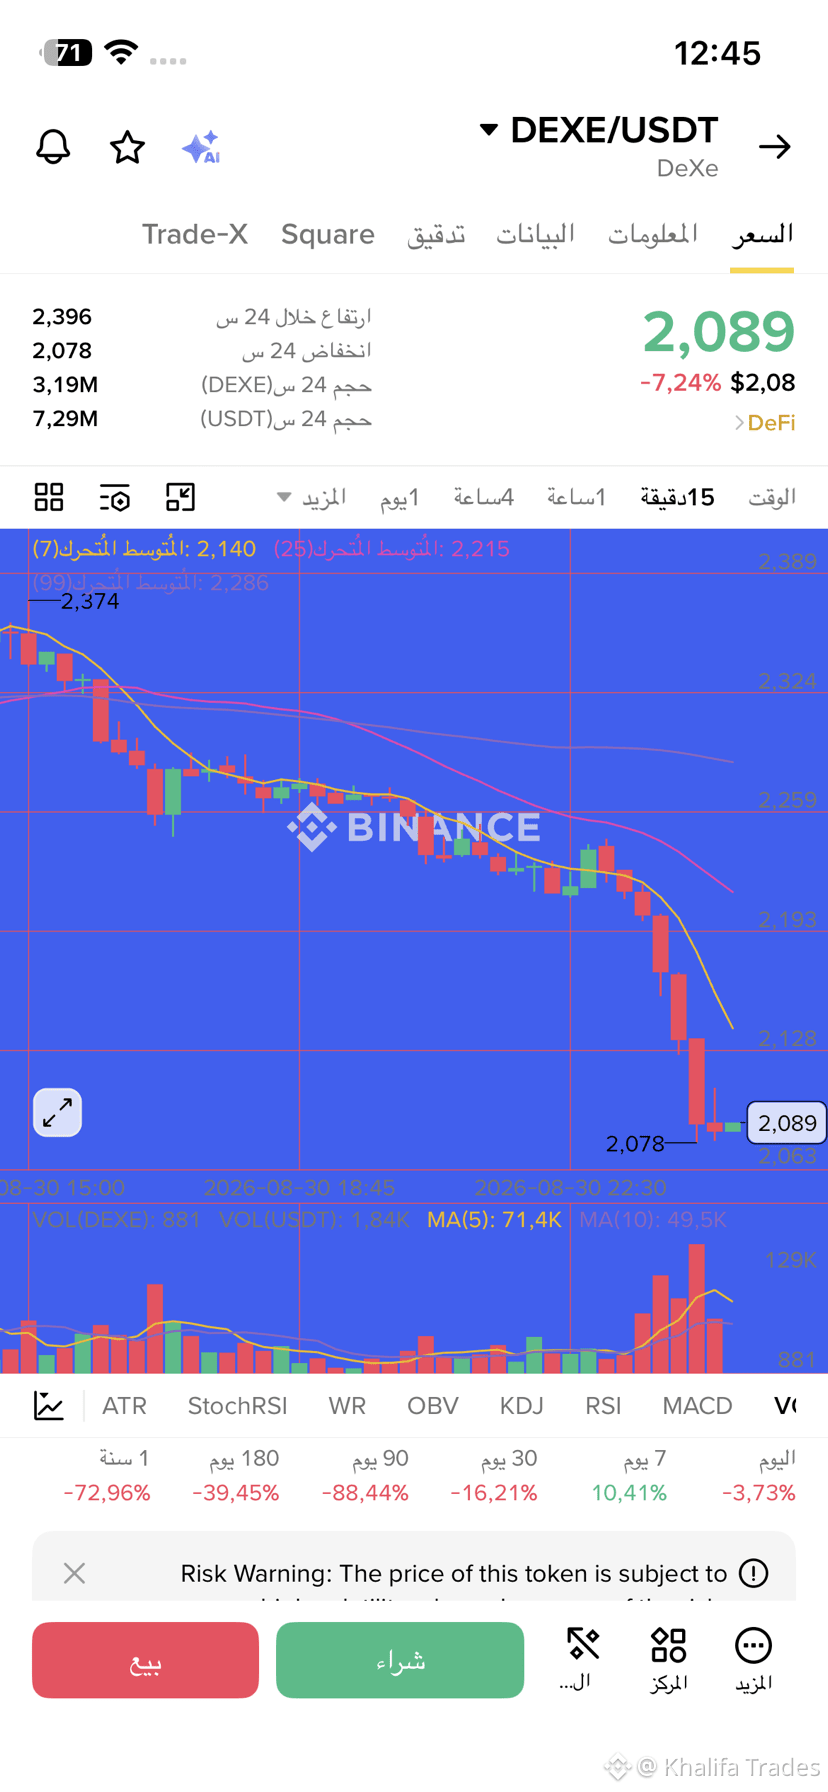
🔥🦅 The In-Depth Technical Analysis of $DEXE ... Reading the battle of candlesticks, the order book, and liquidity-hunting zones! 📉📈
For everyone who defies the language of numbers and Japanese candlesticks on a 15-minute timeframe, here’s the purely technical truth of what’s happening right now on the DEXE chart:
1️⃣ Candlestick Movement & Price Psychology (Candlestick Dynamics):
• The sharp bearish candle that hit the $2.078 low ended with a “long lower wick” signature, which is a direct technical tell of “Smart Money” entering and snatching liquidity from beneath the margins.
• Failure to close below the main support line confirms that the sellers have lost control, and the current candle is trying to form a bullish engulfing pattern—signaling an immediate upside reversal.
2️⃣ Liquidity Analysis & Buy/Sell Pressure (Volume & Order Flow):
• The trading volumes (Volume) on the recent candles show a clear contraction in selling pressure, alongside quiet accumulation at the lows before the burst of the green impulse candle.
• The Relative Strength Index (RSI) and MACD show a positive crossover and convergence near oversold zones, meaning the price has exhausted its downside momentum and is ready to take off.
3️⃣ Technical Conclusion:
Respect the low and stabilize the price above it means an immediate move toward resistance levels. 🦅💎
#DEXE #BinanceSquare #KhalifaTrades #TechnicalAnalysis #CryptoTrading
$DEXE
For everyone who defies the language of numbers and Japanese candlesticks on a 15-minute timeframe, here’s the purely technical truth of what’s happening right now on the DEXE chart:
1️⃣ Candlestick Movement & Price Psychology (Candlestick Dynamics):
• The sharp bearish candle that hit the $2.078 low ended with a “long lower wick” signature, which is a direct technical tell of “Smart Money” entering and snatching liquidity from beneath the margins.
• Failure to close below the main support line confirms that the sellers have lost control, and the current candle is trying to form a bullish engulfing pattern—signaling an immediate upside reversal.
2️⃣ Liquidity Analysis & Buy/Sell Pressure (Volume & Order Flow):
• The trading volumes (Volume) on the recent candles show a clear contraction in selling pressure, alongside quiet accumulation at the lows before the burst of the green impulse candle.
• The Relative Strength Index (RSI) and MACD show a positive crossover and convergence near oversold zones, meaning the price has exhausted its downside momentum and is ready to take off.
3️⃣ Technical Conclusion:
Respect the low and stabilize the price above it means an immediate move toward resistance levels. 🦅💎
#DEXE #BinanceSquare #KhalifaTrades #TechnicalAnalysis #CryptoTrading
$DEXE