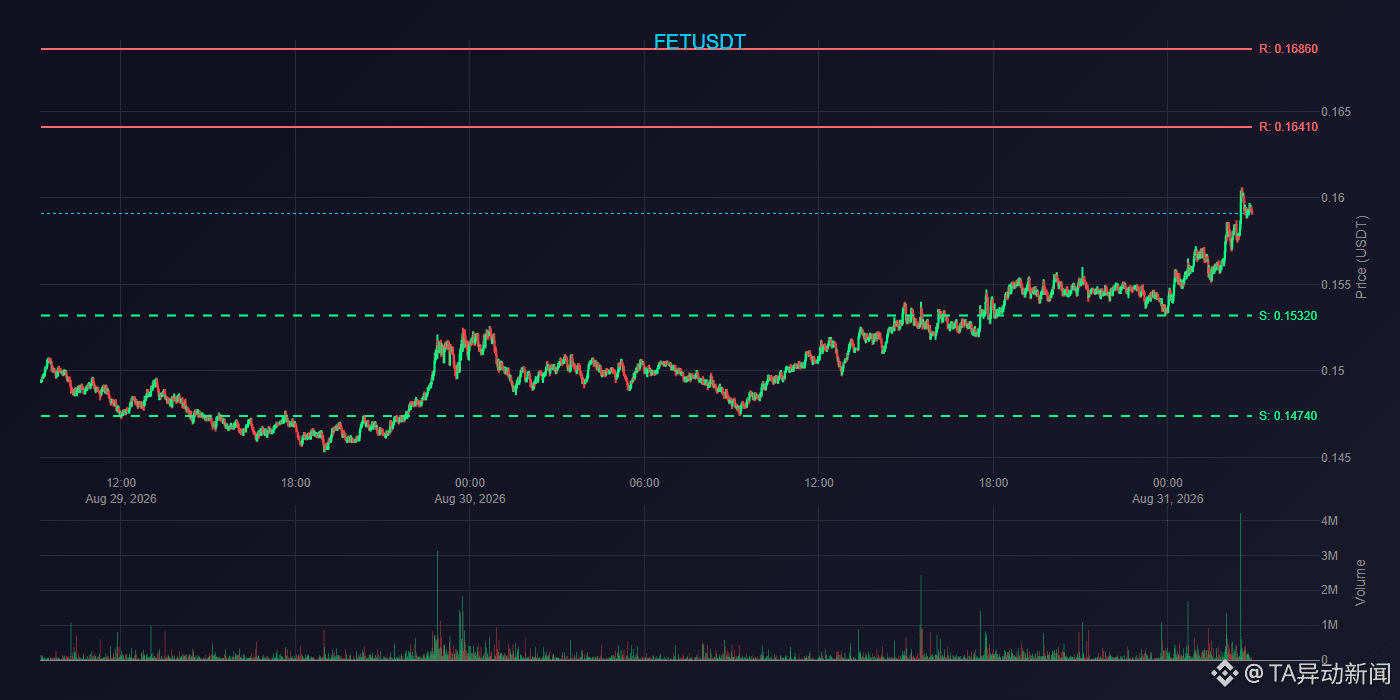
$FET 's sudden 15-minute volume surge expands sharply—volume runs up to the high range, but the price only inches higher, forming a classic volume–price divergence structure. In the 24-hour turnover ranking it ranks farther down; the float itself isn’t big enough to support sustained upward pushing. The trend-acceleration signal also hasn’t been confirmed, indicating that bullish momentum never truly kicked in. In this kind of tape, it’s likely that the main players are probing the market or using wash trades to lure longs; after that, a pullback is highly probable. The last time I saw a similar setup, after volume expanded without price rising, the operator directly sold it down—within minutes it broke through the stop-loss. In this structure now, a breakout above the overhead pressure zone that can’t be achieved is basically pointless. Once support below is lost, price will likely keep probing lower. If you’re holding coins, your first reaction should be to reduce exposure. If you’re currently in cash, don’t rush to enter—wait for direction confirmation before acting. Chasing longs is essentially handing money to the main players.
$BTC
📊 Technical Analysis:
Current Price: 0.1591 USDT
🟢 Support: 0.1532 (Distance from 1H benchmark: 2.67%)
🔴 Resistance: 0.1641 (Distance from 1H benchmark: 4.26%)
💡 Entry Strategy: Near the support level, you can place buy orders; if price breaks below support, place a stop-loss.
$FET
$BTC
📊 Technical Analysis:
Current Price: 0.1591 USDT
🟢 Support: 0.1532 (Distance from 1H benchmark: 2.67%)
🔴 Resistance: 0.1641 (Distance from 1H benchmark: 4.26%)
💡 Entry Strategy: Near the support level, you can place buy orders; if price breaks below support, place a stop-loss.
$FET