$BTC cryptocurrency academic: After Bitcoin (BTC) surged on 8.31, it enters a consolidation and adjustment phase—how to clear the fog on the BTC order book and find direction? Latest market analysis and trade recommendations
Bitcoin’s current price is 78,750, and it hasn’t continued to break upward. Instead, it has turned into high-level range-bound consolidation and washout. Many friends are recently quite conflicted: should you chase after a rise or go short on rallies? You’re afraid that once you buy, you’ll be stuck near the top, and once you sell, you’ll miss the next wave of upside. After a big rally, the high-range area most easily throws people’s mindset off balance. A little rise makes you fantasize about a ten-thousand-point bull market, while a slight drop makes you panic about a major correction. With the current price at 78,750, the long-versus-short battle in the market has entered an intense stage. Don’t let intraday spikes and short-term up/down swings throw off your rhythm.
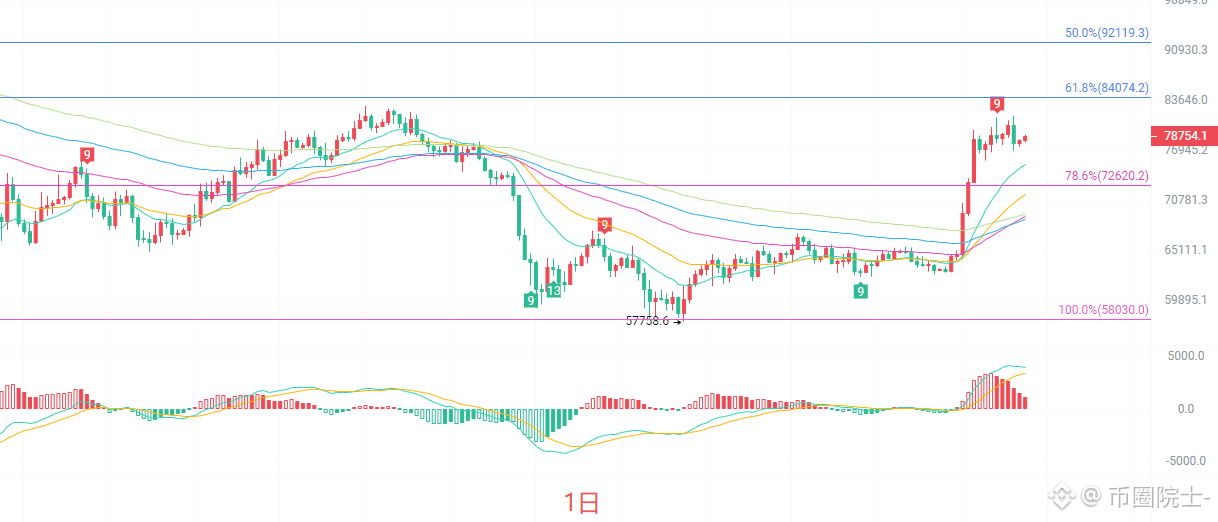
The daily K-line has held above all EMA moving averages. The medium- and long-term moving averages are diverging upward, and the larger trend still maintains a bullish structure. The MACD histogram’s red bars have contracted somewhat; compared with the peak phase, bullish momentum has clearly weakened, and there is a need for short-term pullback to build energy. The Bollinger Bands are opening upward. The current price is trading inside the upper band on the inner side. Strong resistance is seen around 84,072. On the downside, the key support lies at the 78.6% Fibonacci level, 72,620. On the daily chart, there is no clear top-reversal signal, but the momentum of the high-level rally is fading. It’s not suitable to blindly chase longs. The market is likely entering a wide-range consolidation phase, waiting for a directional choice. In terms of execution, it’s preferable to wait for a pullback to support before considering positioning.
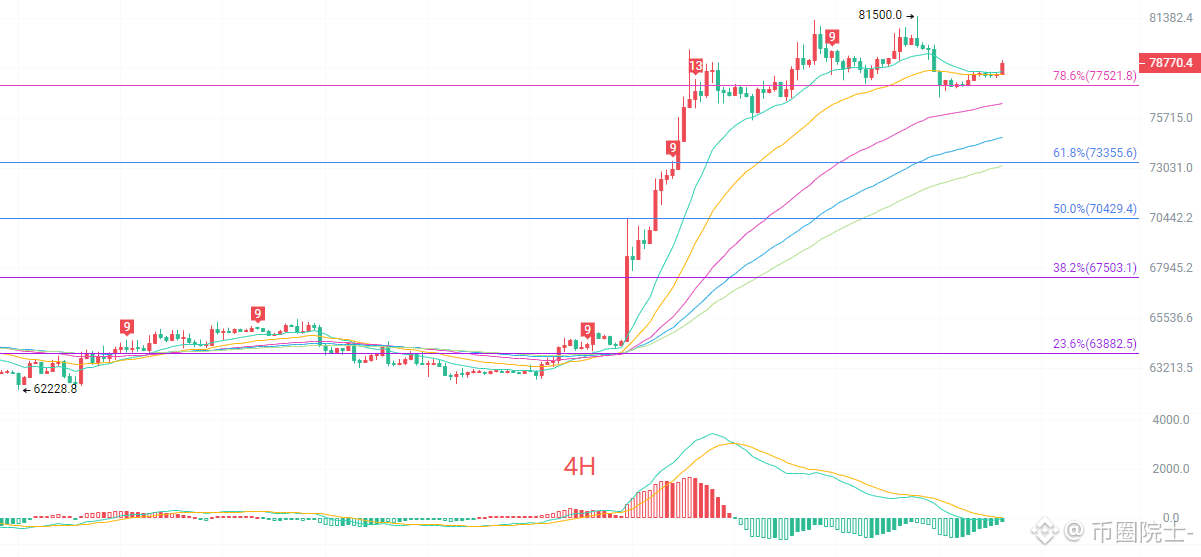
The four-hour K-line is consolidating above the 78.6% Fibonacci level at 77,521. The short-term EMA moving average set is still aligned bullishly, but the short-term averages are intertwined, and upward strength has slowed. The MACD has entered the green histogram zone; short-term bearish power is being released. This is more of a repair/adjustment after a rise. The Bollinger Bands’ middle rail forms an important short-term support. Below, the key support is 77,521, and further stronger support is 73,355. Overhead resistance remains the previous high at 81,500. Only if price can effectively hold above that level will bulls restart the next wave of upward push. The four-hour timeframe is currently in a high-level consolidation-and-repair mode and has not broken into a one-way trend. Price spikes up and down with frequent wicks will be very common. In the short term, avoid chasing highs and cutting lows; try to trade near support/resistance zones.
Short-term reference:
- From 77,600 to 77,200 northbound: stop-loss 500 points. Target: 80,200 to 81,200
- From 81,200 to 81,600 southbound: stop-loss 500 points. Target: 80,000 to 79,000
#BTC走势分析
Bitcoin’s current price is 78,750, and it hasn’t continued to break upward. Instead, it has turned into high-level range-bound consolidation and washout. Many friends are recently quite conflicted: should you chase after a rise or go short on rallies? You’re afraid that once you buy, you’ll be stuck near the top, and once you sell, you’ll miss the next wave of upside. After a big rally, the high-range area most easily throws people’s mindset off balance. A little rise makes you fantasize about a ten-thousand-point bull market, while a slight drop makes you panic about a major correction. With the current price at 78,750, the long-versus-short battle in the market has entered an intense stage. Don’t let intraday spikes and short-term up/down swings throw off your rhythm.
The daily K-line has held above all EMA moving averages. The medium- and long-term moving averages are diverging upward, and the larger trend still maintains a bullish structure. The MACD histogram’s red bars have contracted somewhat; compared with the peak phase, bullish momentum has clearly weakened, and there is a need for short-term pullback to build energy. The Bollinger Bands are opening upward. The current price is trading inside the upper band on the inner side. Strong resistance is seen around 84,072. On the downside, the key support lies at the 78.6% Fibonacci level, 72,620. On the daily chart, there is no clear top-reversal signal, but the momentum of the high-level rally is fading. It’s not suitable to blindly chase longs. The market is likely entering a wide-range consolidation phase, waiting for a directional choice. In terms of execution, it’s preferable to wait for a pullback to support before considering positioning.
The four-hour K-line is consolidating above the 78.6% Fibonacci level at 77,521. The short-term EMA moving average set is still aligned bullishly, but the short-term averages are intertwined, and upward strength has slowed. The MACD has entered the green histogram zone; short-term bearish power is being released. This is more of a repair/adjustment after a rise. The Bollinger Bands’ middle rail forms an important short-term support. Below, the key support is 77,521, and further stronger support is 73,355. Overhead resistance remains the previous high at 81,500. Only if price can effectively hold above that level will bulls restart the next wave of upward push. The four-hour timeframe is currently in a high-level consolidation-and-repair mode and has not broken into a one-way trend. Price spikes up and down with frequent wicks will be very common. In the short term, avoid chasing highs and cutting lows; try to trade near support/resistance zones.
Short-term reference:
- From 77,600 to 77,200 northbound: stop-loss 500 points. Target: 80,200 to 81,200
- From 81,200 to 81,600 southbound: stop-loss 500 points. Target: 80,000 to 79,000
#BTC走势分析