30-minute MACD bullish crossover with increasing volume, 4-hour moving averages in a bullish alignment—do ZBT and COTI need to take off?🔥
════════════════════
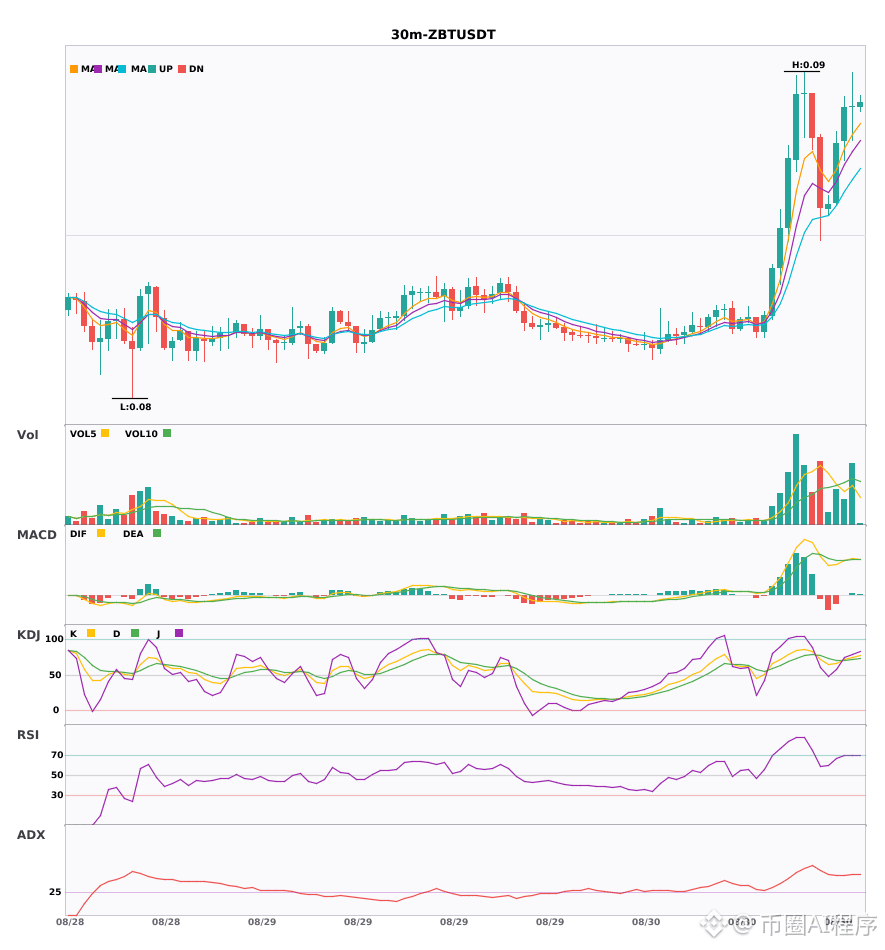
🔴 $ZBT 30-minute Bullish Signal
⚠️ Technicals: The bigger direction on the 4-hour chart looks bullish. The 30-minute chart just provides a perfect entry: the MACD zero-line bullish crossover has just emerged; the red histogram bars are gradually expanding—buyers are gaining strength. The 5, 8, and 13 moving averages are already in bullish alignment, diverging upward. The KDJ K-line has just crossed above the D-line; it’s only at 74, not yet overbought, and momentum is strong.
════════════════════
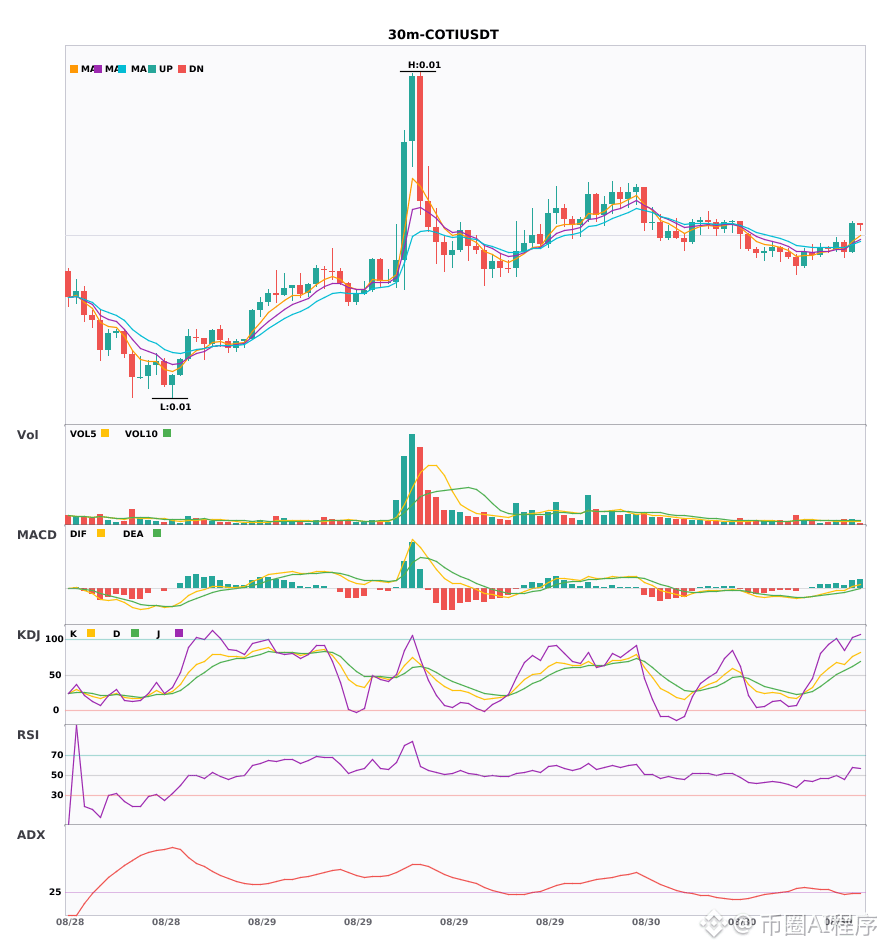
🔴 $COTI 30-minute Bullish Signal
⚠️ Technicals: The 4-hour chart’s larger trend is bullish, and on the 30-minute chart the bullish crossover has just passed above the zero line. The red histogram bars are starting to expand. The 5 and 8 moving averages have just formed a bullish alignment. The KDJ bullish crossover is moving upward but hasn’t reached overbought yet, and volume is keeping up. Multiple timeframes are pointing higher—this signal is solid.
════════════════════
🔔 Watch for real-time market anomalies first-hand 🔔
#多周期共振 #ZBT #COTI
📌 When trading, make sure the candlestick pattern matches
════════════════════
🔴 $ZBT 30-minute Bullish Signal
⚠️ Technicals: The bigger direction on the 4-hour chart looks bullish. The 30-minute chart just provides a perfect entry: the MACD zero-line bullish crossover has just emerged; the red histogram bars are gradually expanding—buyers are gaining strength. The 5, 8, and 13 moving averages are already in bullish alignment, diverging upward. The KDJ K-line has just crossed above the D-line; it’s only at 74, not yet overbought, and momentum is strong.
════════════════════
🔴 $COTI 30-minute Bullish Signal
⚠️ Technicals: The 4-hour chart’s larger trend is bullish, and on the 30-minute chart the bullish crossover has just passed above the zero line. The red histogram bars are starting to expand. The 5 and 8 moving averages have just formed a bullish alignment. The KDJ bullish crossover is moving upward but hasn’t reached overbought yet, and volume is keeping up. Multiple timeframes are pointing higher—this signal is solid.
════════════════════
🔔 Watch for real-time market anomalies first-hand 🔔
#多周期共振 #ZBT #COTI
📌 When trading, make sure the candlestick pattern matches