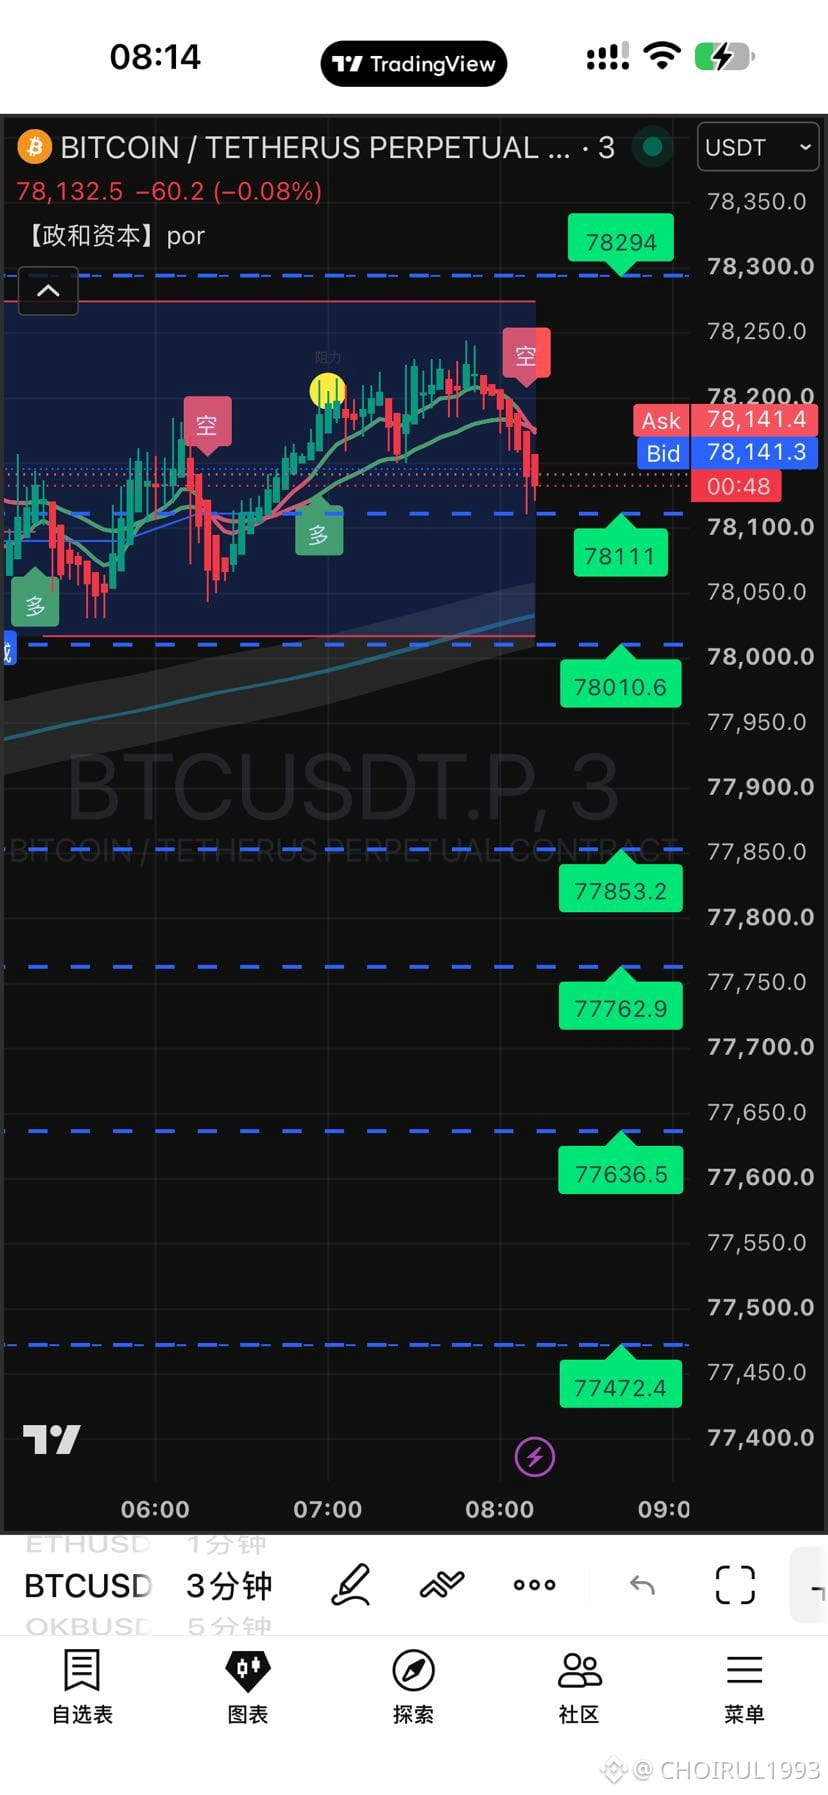
Technical Analysis of the BTC Contract on 30 August 2026 (Sunday)
The current BTC spot/perpetual contract price is in the range of 78,200–78,300 US dollars (real-time price follows the order book). After falling from a peak of about 81,300 US dollars on 28 August to around 76,900–77,800 US dollars, on 29 August the price began to stabilize and partially recover the decline. The strong rebound structure that started around 62,000–64,000 US dollars in mid-August is still intact, and in the short term the market has entered a consolidation and recovery phase following the correction.
The following is a multi-timeframe technical summary (based on publicly available charts and indicator data, for reference only, not investment advice).
I. Short term (daily/4 hours)
• Trend: The bullish medium-term trend continues and stabilizes after the short-term correction. Price slipped from above 81,000, and is currently consolidating and recovering above 78,000.
• Indicators:
◦ RSI(14) has fallen from the overbought area to around 65–70, still leaning bullish.
◦ MACD remains in a bullish zone, with signs of stabilizing as the histogram shrinks.
◦ Moving averages: Price is still above most short- and medium-term MAs (including the 50/100/200-day MA); the bullish structure has not been broken.
• Key levels:
◦ Resistance: 79,000–80,000; 81,000–81,500 (area of the latest high); 83,000–85,000.
◦ Support: 77,000–77,500; 76,000–76,500; 74,500–75,000.
II. Medium term (weekly)
• The upward breakout structure from the prior trading range on the weekly chart is still intact, with key support at 73,000–75,000. As long as it does not break convincingly below this zone, the bullish medium-term trend remains robust.
• Weekly RSI and MACD still support the continuation of the bullish trend.
III. Long-term outlook
• In the monthly/quarterly perspective, price is still in the process of recovery i
The current BTC spot/perpetual contract price is in the range of 78,200–78,300 US dollars (real-time price follows the order book). After falling from a peak of about 81,300 US dollars on 28 August to around 76,900–77,800 US dollars, on 29 August the price began to stabilize and partially recover the decline. The strong rebound structure that started around 62,000–64,000 US dollars in mid-August is still intact, and in the short term the market has entered a consolidation and recovery phase following the correction.
The following is a multi-timeframe technical summary (based on publicly available charts and indicator data, for reference only, not investment advice).
I. Short term (daily/4 hours)
• Trend: The bullish medium-term trend continues and stabilizes after the short-term correction. Price slipped from above 81,000, and is currently consolidating and recovering above 78,000.
• Indicators:
◦ RSI(14) has fallen from the overbought area to around 65–70, still leaning bullish.
◦ MACD remains in a bullish zone, with signs of stabilizing as the histogram shrinks.
◦ Moving averages: Price is still above most short- and medium-term MAs (including the 50/100/200-day MA); the bullish structure has not been broken.
• Key levels:
◦ Resistance: 79,000–80,000; 81,000–81,500 (area of the latest high); 83,000–85,000.
◦ Support: 77,000–77,500; 76,000–76,500; 74,500–75,000.
II. Medium term (weekly)
• The upward breakout structure from the prior trading range on the weekly chart is still intact, with key support at 73,000–75,000. As long as it does not break convincingly below this zone, the bullish medium-term trend remains robust.
• Weekly RSI and MACD still support the continuation of the bullish trend.
III. Long-term outlook
• In the monthly/quarterly perspective, price is still in the process of recovery i