$ZKC
ZKC/USDT 4-Hour Chart Breakdown📈🚀
Looking at this 4-hour chart for ZKC/USDT,
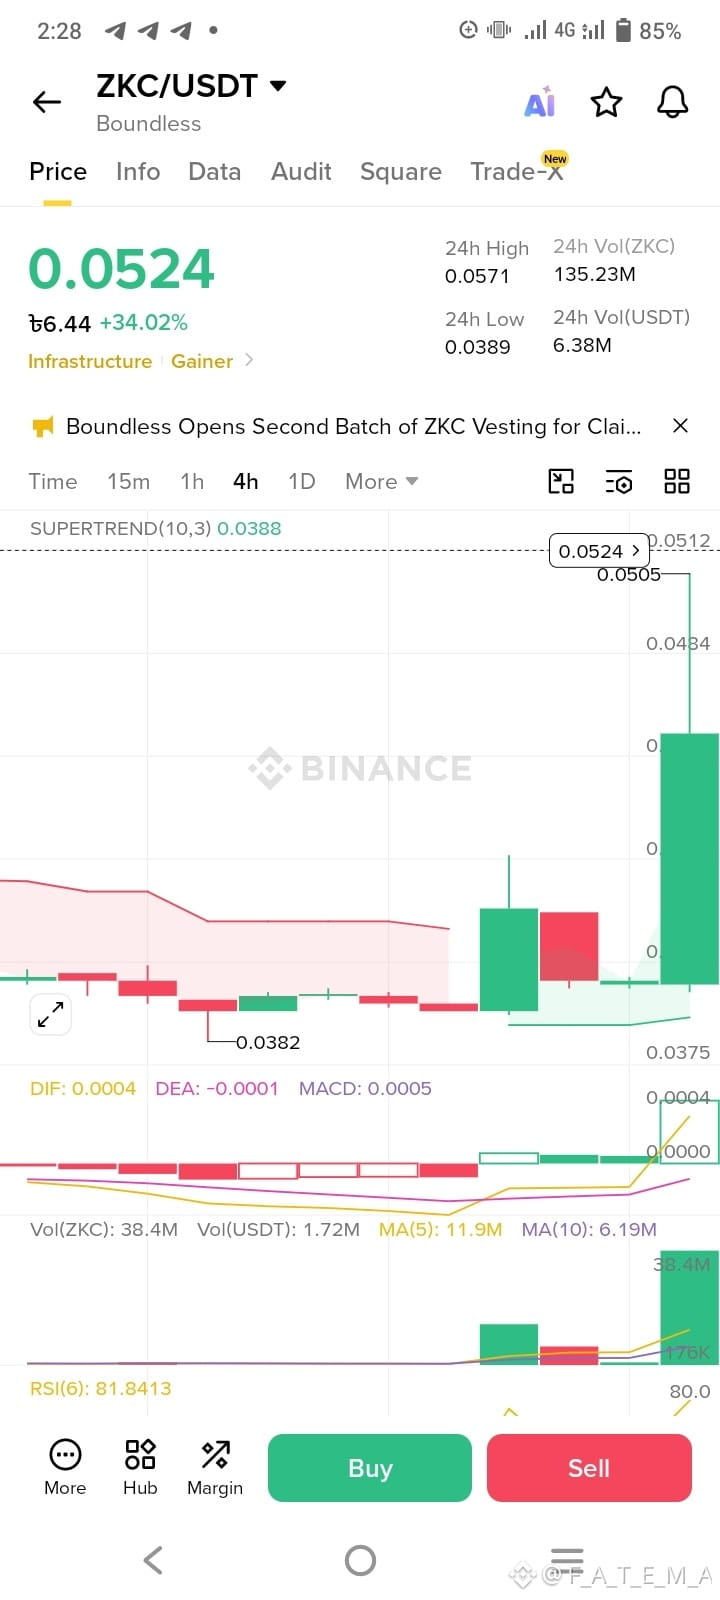
we're seeing some serious fireworks! 🔥 The price just rocketed up to **0.0524**, marking a massive **+34.02%** pump 🚀📊. Let's break down what the indicators are telling us without getting too robotic about it.
Price Action & Momentum:
That massive green candle on the right completely shatters the previous tight range near the **0.0382** support zone 🟢💪. Buyers stepped in aggressively, pushing the 24-hour high up to **0.0571** 🎯.
RSI (Relative Strength Index):
Sitting hot at **81.84**, the RSI is deep in the **overbought** territory ⚠️🔥. While it shows incredible bullish strength right now, it also means a short-term pullback or cooling-off period could happen any second 📉.
MACD Indicator:
DIF is at **0.0004** and MACD reads **0.0005**, crossing cleanly into bullish territory 🟢✨. The momentum lines are expanding upward, confirming that the bulls currently own this trend 🐂📈.
Volume Surge:
Look at that massive volume spike at the bottom right (38.4M ZKC) 📊💥! That kind of heavy volume backs up the price breakout, proving there's real capital driving this move rather than just a low-liquidity flash pump 💧🤝.
The Verdict:
The trend is undeniably bullish in the short term, but chasing green candles at an 81+ RSI is a recipe for getting trapped at the local top 🛑📉. If you're eyeing an entry, patience is key ⏳.
Wait for a healthy retest or consolidation near lower support levels before jumping in, and always manage your risk tightly with a stop-loss 🛡️📉!
💎🐾 *WAGMI, but trade smart!* 🚀🔥
#FutureTarding #ZKC
ZKC/USDT 4-Hour Chart Breakdown📈🚀
Looking at this 4-hour chart for ZKC/USDT,
we're seeing some serious fireworks! 🔥 The price just rocketed up to **0.0524**, marking a massive **+34.02%** pump 🚀📊. Let's break down what the indicators are telling us without getting too robotic about it.
Price Action & Momentum:
That massive green candle on the right completely shatters the previous tight range near the **0.0382** support zone 🟢💪. Buyers stepped in aggressively, pushing the 24-hour high up to **0.0571** 🎯.
RSI (Relative Strength Index):
Sitting hot at **81.84**, the RSI is deep in the **overbought** territory ⚠️🔥. While it shows incredible bullish strength right now, it also means a short-term pullback or cooling-off period could happen any second 📉.
MACD Indicator:
DIF is at **0.0004** and MACD reads **0.0005**, crossing cleanly into bullish territory 🟢✨. The momentum lines are expanding upward, confirming that the bulls currently own this trend 🐂📈.
Volume Surge:
Look at that massive volume spike at the bottom right (38.4M ZKC) 📊💥! That kind of heavy volume backs up the price breakout, proving there's real capital driving this move rather than just a low-liquidity flash pump 💧🤝.
The Verdict:
The trend is undeniably bullish in the short term, but chasing green candles at an 81+ RSI is a recipe for getting trapped at the local top 🛑📉. If you're eyeing an entry, patience is key ⏳.
Wait for a healthy retest or consolidation near lower support levels before jumping in, and always manage your risk tightly with a stop-loss 🛡️📉!
💎🐾 *WAGMI, but trade smart!* 🚀🔥
#FutureTarding #ZKC