
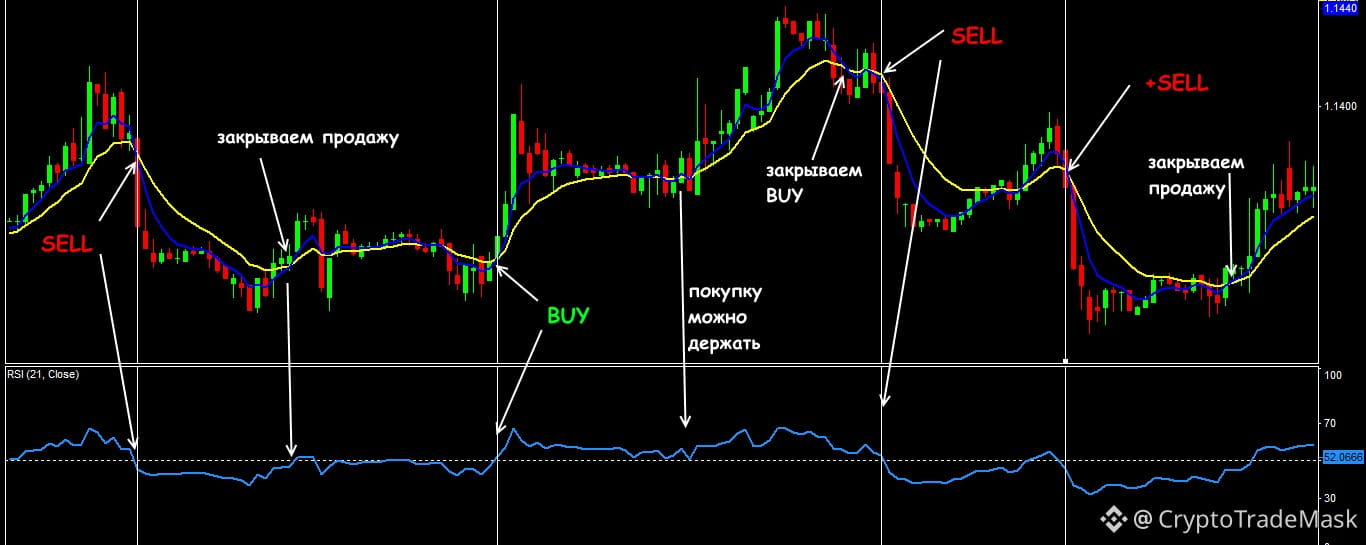

Trading with the trend is a fundamental approach in trading, based on the market’s core principle: momentum moves always have a higher probability of continuation than a reversal. However, trying to enter on impulses ("at the highs" or "at the lows") most often leads to losses due to the price immediately retracing.
The classic trend strategy solves this problem with a three-component system: Direction + Pullback + Support/Resistance level. This guide is designed for trading on medium and higher timeframes (1H, 4H, 1D).
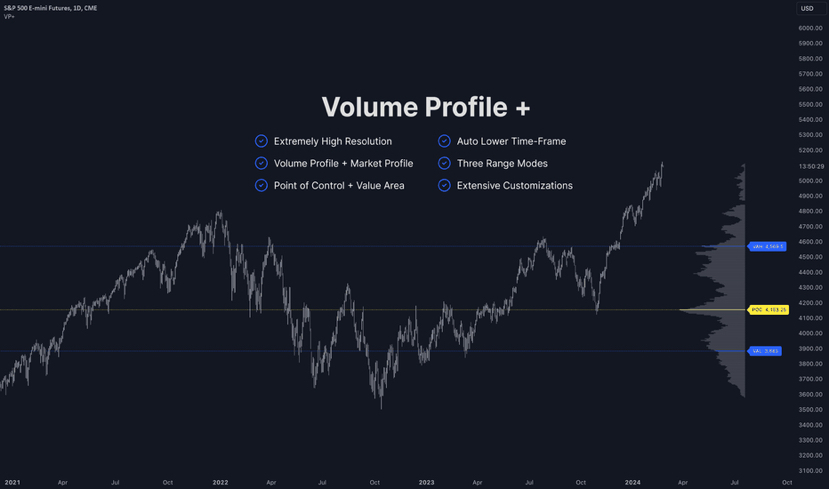

1. Setup architecture: Triple filter
Each indicator in this system performs a strictly defined function. They don’t duplicate each other — they create a filtering sieve to weed out false signals.
1. Trend direction: EMA 200 + EMA 50 (Filters the global direction — we only look for LONG/SHORT).
2. Rejection level: Volume Profile / VRVP (POC / High Volume) (Filters the ENTRY PRICE — we look for a reaction from volume).
3. Entry trigger: RSI (14) or Stoch RSI (Filters the TIME of entry — we look for the moment the impulse reverses).

2. Deep analysis of each instrument
Exponential moving averages: EMA 200 and EMA 50
Instead of standard SMAs, Exponential smoothing is used (EMA), because it gives more weight to fresh price data and responds faster to changes in market dynamics.
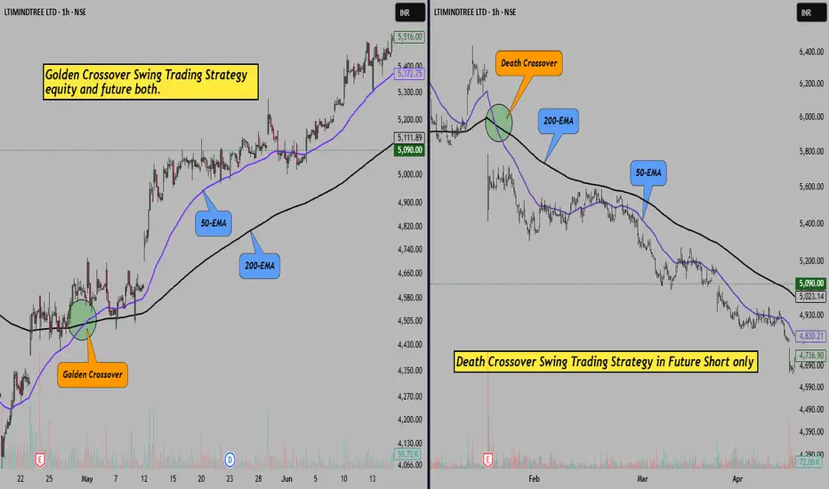
EMA 200 (Global trend): Serves as the market’s waterline. If price is above EMA 200, the global trend is considered bullish (only long positions are allowed). If below — it’s bearish (only shorts).
EMA 50 (Local trend and dynamic level): Shows the medium-term momentum and acts as the first support/resistance line during pullbacks.
Golden cross / Death cross: When EMA 50 crosses above EMA 200, it confirms the start of a strong local uptrend. The distance between EMA 50 and EMA 200 indicates the strength of momentum (an opening “fan” — strengthening the trend).

Volume Profile / VRVP (Visible volume profile)
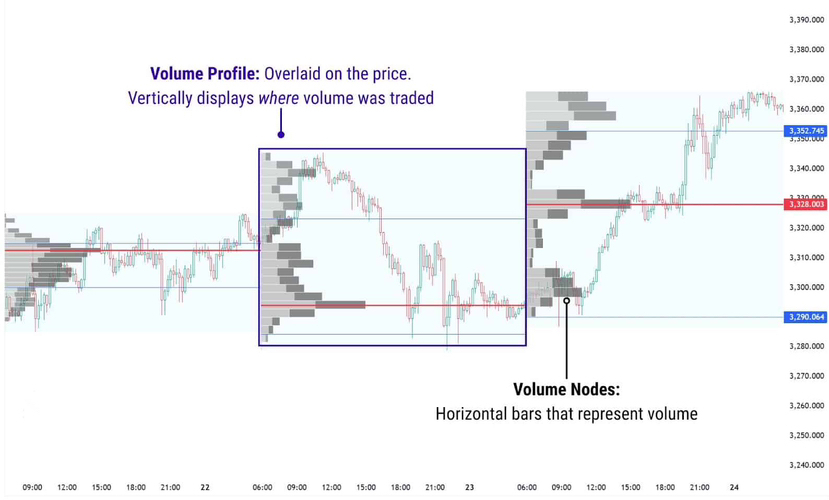
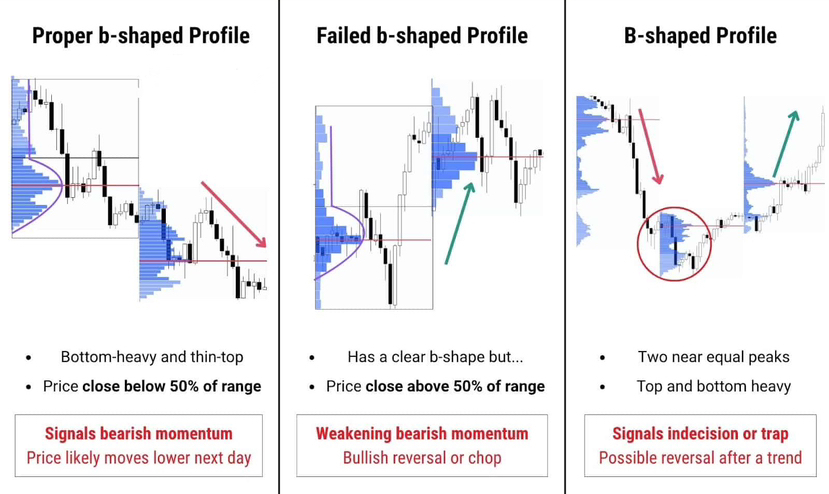
Unlike standard vertical volume bars that show when trading happened, VRVP shows at which price levels the most interest from large players accumulated.
POC (Point of Control): The price level with the highest traded volume for the selected period. It works as the strongest magnet and a support/resistance level.
HVN (High Volume Node): High-volume zones (volume shelves). They serve as the place where market makers’ orders “clamp together.” Price slows down or bounces off these zones.
LVN (Low Volume Node): Low-volume zones. Price passes through them quickly, so opening positions inside LVN is extremely risky.
Oscillators: RSI (14) or Stochastic RSI
Oscillators are needed to detect the phase of exhaustion of a local pullback.
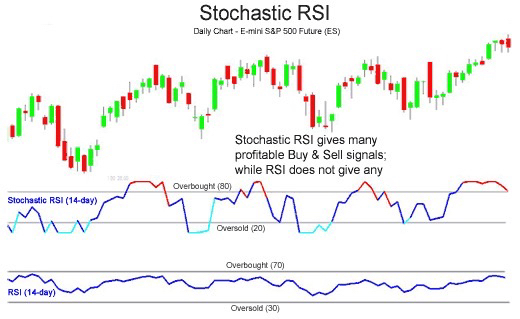
RSI (14): Measures the speed and change of price movements. In an uptrend, the 30–40 zone is considered a local oversold area (significantly more reliable than waiting for a drop below 30 during a strong trend).
Stochastic RSI: A more sensitive indicator that calculates RSI based on the RSI itself. It quickly provides a signal (a cross of %K and %D in the zone below 20), allowing you to catch the exact candle reversal.
3. Clear algorithms for entering a position
Scenario 1: LONG (Buy)
1. Global filter: Price is confidently trading above EMA 200, and EMA 50 is above EMA 200.
2. Pullback expectation: Price corrects from below toward EMA 50 or EMA 200.
3. Level confirmation: The pullback stops in the POC zone or a strong volume shelf (HVN) according to VRVP.
4. Oscillator signal:
RSI (14) falls into the 30–40 range and turns upward;
OR Stoch RSI forms a line cross in the oversold zone (below 20).
5. Entry into the position: At the close of the first confirming bullish candle (e.g., a pin bar or absorption from the volume level).
Scenario 2: SHORT (Sell)
1. Global filter: Price is below EMA 200, and EMA 50 is below EMA 200.
2. Pullback expectation: Price corrects upward toward EMA 50 or EMA 200.
3. Level confirmation: Price hits the POC or the HVN volume shelf from above.
4. Oscillator signal:
RSI (14) rises into the 60–70 range and then turns back down;
OR Stoch RSI forms a cross in the overbought zone (above 80).
5. Entry into the position: At the close of the first bearish reversal candle.
4. Risk management and trade management
The success of the strategy depends not so much on the exact entry, but on mathematical expectancy (Risk/Reward Ratio).
Parameters for the LONG Position (Buy):
Stop Loss: At the nearest local low + the POC/HVN level (0.3–0.5% below the volume zone).
Take Profit 1 (50%): At the nearest local maximum (1:1.5 or 1:2) → Move to breakeven.
Take Profit 2 (50%): The next strong resistance level by VRVP, or exit on the opposite Stoch RSI signal.
⚠️ Risk per trade: 1–2% of the total deposit.
Parameters for the SHORT Position (Sell):
Stop Loss: At the nearest local high + the POC/HVN level (0.3–0.5% above the volume zone).
Take Profit 1 (50%): At the nearest local minimum (1:1.5 or 1:2) — move to breakeven.
Take Profit 2 (50%): The next strong support level according to VRVP, or the opposite signal of Stoch RSI.
⚠️ Risk per trade: 1–2% of the total deposit.
5. Pitfalls and common mistakes
Trading in a sideways market (range): When the market moves within a narrow band, EMA 50 and EMA 200 intertwine, and oscillators produce many false signals. The strategy should be used only when there is a clearly noticeable angle of the moving averages.
Catching “falling knives”: You should not open a limit order just because the price touched the POC. обязательно wait for the oscillator’s reaction and the formation of a reversal candlestick pattern.
Ignoring the higher timeframe: If you look for an entry on 1H, check the trend on 4H and 1D. Trading against the trend of the higher timeframe significantly reduces the percentage of profitable trades.
Full guide to “Indicator Sets”: How to compile trading strategies that work