TUT Token experiences a bullish surge of 156% in the past month: What’s behind its move?
The market for digital assets continues to offer highly volatile swings and technical analysis opportunities. On this occasion, the TUT (Tutorial) token, traded in the TUT/USDT pair, has drawn traders’ attention after recording a notable rally on its short-term charts and accumulating growth of over 156% in the last 30 days.
A key rebound on the intraday chart
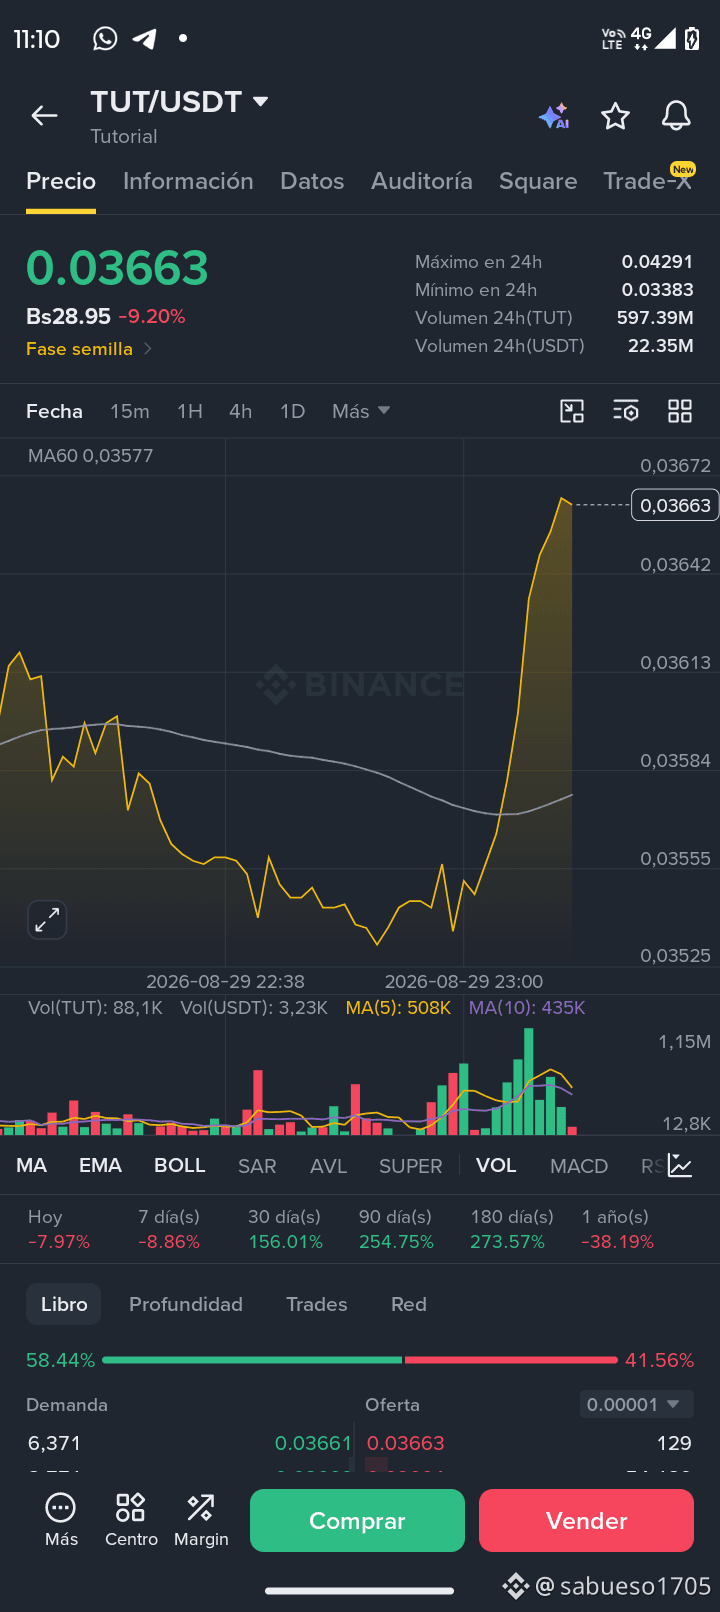
After testing a local support level in the $0.03525 USDT area, TUT’s price saw a rapid bullish reaction driven by an increase in buy volume. Within minutes, the asset broke above its 60-period moving average (MA60 at $0.03577), rising to the $0.03663 USDT zone.
This move is accompanied by a clear dominance in the depth of the order book in the short term, where buy demand accounts for 58.44% versus a sell offer of 41.56%.
Key asset data
Six-month performance: Despite corrections in the broader market, TUT shows sustained accumulated performance over the last 180 days, reaching an increase of 273.57%.
Volume activity: In the last 24 hours, the pair has moved more than 22.35 million USDT, demonstrating active liquidity within its category.
Platform classification: The token trades under the Seed Phase label (Seed Tag), attracting operators looking for projects in the early stages of development.
Outlook for the project
TUT’s recent behavior reflects how lower-cap assets can generate quick recovery moves when volume enters the market. Analysts suggest monitoring whether the price manages to consolidate above the immediate resistance of $0.03670 USDT to confirm the continuation of the trend, or whether it will pull back to test the day’s lows near $0.03383 USDT.
$TUT
The market for digital assets continues to offer highly volatile swings and technical analysis opportunities. On this occasion, the TUT (Tutorial) token, traded in the TUT/USDT pair, has drawn traders’ attention after recording a notable rally on its short-term charts and accumulating growth of over 156% in the last 30 days.
A key rebound on the intraday chart
After testing a local support level in the $0.03525 USDT area, TUT’s price saw a rapid bullish reaction driven by an increase in buy volume. Within minutes, the asset broke above its 60-period moving average (MA60 at $0.03577), rising to the $0.03663 USDT zone.
This move is accompanied by a clear dominance in the depth of the order book in the short term, where buy demand accounts for 58.44% versus a sell offer of 41.56%.
Key asset data
Six-month performance: Despite corrections in the broader market, TUT shows sustained accumulated performance over the last 180 days, reaching an increase of 273.57%.
Volume activity: In the last 24 hours, the pair has moved more than 22.35 million USDT, demonstrating active liquidity within its category.
Platform classification: The token trades under the Seed Phase label (Seed Tag), attracting operators looking for projects in the early stages of development.
Outlook for the project
TUT’s recent behavior reflects how lower-cap assets can generate quick recovery moves when volume enters the market. Analysts suggest monitoring whether the price manages to consolidate above the immediate resistance of $0.03670 USDT to confirm the continuation of the trend, or whether it will pull back to test the day’s lows near $0.03383 USDT.
$TUT